
Page 107 - Read Online
P. 107
Page 6 of 10 Wang et al. Microstructures 2023;3:2023023 https://dx.doi.org/10.20517/microstructures.2023.04
Figure 3. Temperature-dependent dielectric permittivity and loss of (1-x)BNBT-xSBTZ ceramics from 70 to 400 °C at 1 kHz, 10 kHz,
1 MHz, 10 MHz, and 20 MHz, respectively. (A) x = 0.07, (B) x = 0.09, (C) x = 0.09, and (D) x = 0.10.
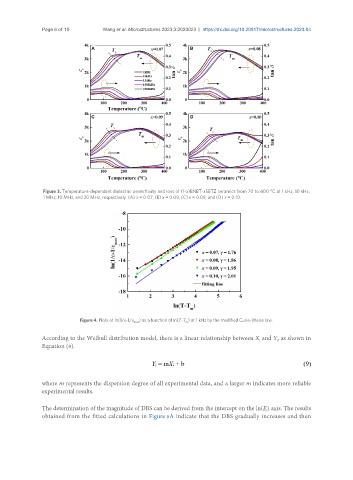
Figure 4. Plots of ln(1/ε-1/ε ) as a function of ln(T-T ) at 1 kHz by the modified Curie-Weiss law.
max m
According to the Weibull distribution model, there is a linear relationship between X and Y, as shown in
i
i
Equation (9).
where m represents the dispersion degree of all experimental data, and a larger m indicates more reliable
experimental results.
The determination of the magnitude of DBS can be derived from the intercept on the ln(E) axis. The results
i
obtained from the fitted calculations in Figure 5A indicate that the DBS gradually increases and then