
Page 47 - Read Online
P. 47
Dela Cruz et al. Microstructures 2023;3:2023012 https://dx.doi.org/10.20517/microstructures.2022.33 Page 7 of 25
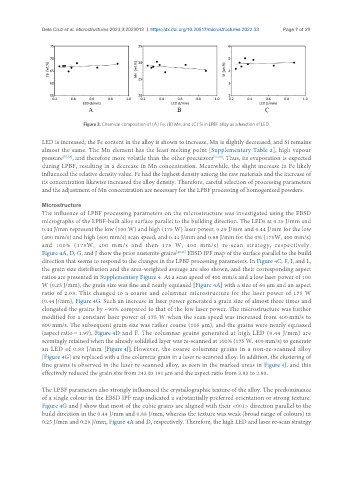
Figure 3. Chemical composition of (A) Fe, (B) Mn, and (C) Si in LPBF alloy as a function of LED.
LED is increased, the Fe content in the alloy is shown to increase, Mn is slightly decreased, and Si remains
almost the same. The Mn element has the least melting point [Supplementary Table 2], high vapour
pressure [57,58] , and therefore more volatile than the other precursors [22,28] . Thus, its evaporation is expected
during LPBF, resulting in a decrease in Mn concentration. Meanwhile, the slight increase in Fe likely
influenced the relative density value. Fe had the highest density among the raw materials and the increase of
its concentration likewise increased the alloy density. Therefore, careful selection of processing parameters
and the adjustment of Mn concentration are necessary for the LPBF processing of homogenised powders.
Microstructure
The influence of LPBF processing parameters on the microstructure was investigated using the EBSD
micrographs of the LPBF-built alloy surface parallel to the building direction. The LEDs at 0.25 J/mm and
0.44 J/mm represent the low (100 W) and high (175 W) laser power, 0.29 J/mm and 0.44 J/mm for the low
(400 mm/s) and high (600 mm/s) scan speed, and 0.44 J/mm and 0.88 J/mm for the 0% (175W, 400 mm/s)
and 100% (175W, 400 mm/s and then 175 W, 400 mm/s) re-scan strategy, respectively.
Figure 4A, D, G, and J show the prior austenite grains [40,41] EBSD IPF map of the surface parallel to the build
direction that seems to respond to the changes in the LPBF processing parameters. In Figure 4C, F, I, and L,
the grain size distribution and the area-weighted average are also shown, and their corresponding aspect
ratios are presented in Supplementary Figure 4. At a scan speed of 400 mm/s and a low laser power of 100
W (0.25 J/mm), the grain size was fine and nearly equiaxed [Figure 4A] with a size of 64 μm and an aspect
ratio of 2.03. This changed to a coarse and columnar microstructure for the laser power of 175 W
(0.44 J/mm), Figure 4G. Such an increase in laser power generated a grain size of almost three times and
elongated the grains by ~90% compared to that of the low laser power. The microstructure was further
modified for a constant laser power of 175 W when the scan speed was increased from 400 mm/s to
600 mm/s. The subsequent grain size was rather coarse (105 μm), and the grains were nearly equiaxed
(aspect ratio = 1.97), Figure 4D and F. The columnar grains generated at high LED (0.44 J/mm) are
seemingly retained when the already solidified layer was re-scanned at 100% (175 W, 400 mm/s) to generate
an LED of 0.88 J/mm [Figure 4J]. However, the coarse columnar grains in a non-re-scanned alloy
[Figure 4G] are replaced with a fine columnar grain in a laser re-scanned alloy. In addition, the clustering of
fine grains is observed in the laser re-scanned alloy, as seen in the marked areas in Figure 4J, and this
effectively reduced the grain size from 242 to 191 μm and the aspect ratio from 3.83 to 2.88.
The LPBF parameters also strongly influenced the crystallographic texture of the alloy. The predominance
of a single colour in the EBSD IPF map indicated a substantially preferred orientation or strong texture.
Figure 4G and J show that most of the cubic grains are aligned with their <001> direction parallel to the
build direction in the 0.44 J/mm and 0.88 J/mm, whereas the texture was weak (broad range of colours) in
0.25 J/mm and 0.29 J/mm, Figure 4A and D, respectively. Therefore, the high LED and laser re-scan strategy