
Page 50 - Read Online
P. 50
Page 10 of 25 Dela Cruz et al. Microstructures 2023;3:2023012 https://dx.doi.org/10.20517/microstructures.2022.33
Table 2. Derived crystal structure, lattice parameters, phase compositions, Bragg R-value (RBragg), and goodness of fit (GOF) of the
LPBF parts built at 0.44 J/mm and 0.88 J/mm energy parameter and then homogenised and HIP treated and reference as-cast alloy
using the Rietveld refinement of the XRD patterns.
LED Phase Space group Lattice parameter Content (vol.%) R GOF
(J/mm) a (Å) c (Å) Bragg
0.25 γ-austenite Fm m 3.600 - 74.6 1.72 4
ε-martensite P6 /mmc 2.535 4.133 19 1.99
3
α-FeMn Im m 2.867 - 2.3 1.39
α-FeSi Im m 2.840 - 2.2 2.19
FeO R m 2.648 7.585 1.9 1.76
0.29 γ-austenite Fm m 3.600 - 68.5 2.76 3.518
ε-martensite P6 /mmc 2.537 4.125 23.9 1.37
3
α-FeMn Im m 2.868 2.8 1.33
α-FeSi Im m 2.843 4.9 0.39
0.44 γ-austenite Fm m 3.600 62.1 1.07 2.196
ε-martensite P6 /mmc 2.535 4.141 31.2 0.79
3
α-FeSi Im m 2.847 6.3 0.44
FeO R m 2.535 0.4 1.71
0.88 γ-austenite Fm m 3.598 52.5 2.31 3.928
ε-martensite P6 /mmc 2.540 4.123 45.8 1.72
3
α-FeMn Im m 2.868 1.4 0.84
α-FeSi Im m 2.837 0.2 1.01
As-cast γ-austenite Fm m 3.602 100 - -
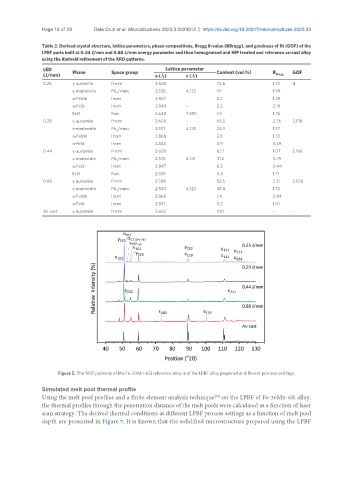
Figure 5. The XRD patterns of the Fe-30Mn-6Si reference alloy and the LPBF alloy prepared at different process settings.
Simulated melt pool thermal profile
Using the melt pool profiles and a finite element analysis technique on the LPBF of Fe-30Mn-6Si alloy,
[64]
the thermal profiles through the penetration distance of the melt pools were calculated as a function of laser
scan strategy. The derived thermal conditions at different LPBF process settings as a function of melt pool
depth are presented in Figure 7. It is known that the solidified microstructure prepared using the LPBF