
Page 52 - Read Online
P. 52
Page 12 of 25 Dela Cruz et al. Microstructures 2023;3:2023012 https://dx.doi.org/10.20517/microstructures.2022.33
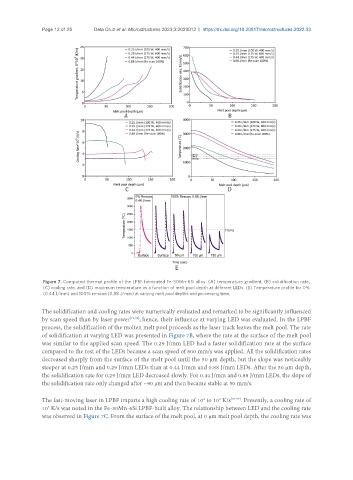
Figure 7. Computed thermal profile of the LPBF fabricated Fe-30Mn-6Si alloy. (A) temperature gradient, (B) solidification rate,
(C) cooling rate, and (D) maximum temperature as a function of melt pool depth at different LEDs. (E) Temperature profile for 0%
(0.44 J/mm) and 100% re-scan (0.88 J/mm) at varying melt pool depths and processing time.
The solidification and cooling rates were numerically evaluated and remarked to be significantly influenced
by scan speed than by laser power [73,74] ; hence, their influence at varying LED was evaluated. In the LPBF
process, the solidification of the molten melt pool proceeds as the laser track leaves the melt pool. The rate
of solidification at varying LED was presented in Figure 7B, where the rate at the surface of the melt pool
was similar to the applied scan speed. The 0.29 J/mm LED had a faster solidification rate at the surface
compared to the rest of the LEDs because a scan speed of 600 mm/s was applied. All the solidification rates
decreased sharply from the surface of the melt pool until the 50 μm depth, but the slope was noticeably
steeper at 0.25 J/mm and 0.29 J/mm LEDs than at 0.44 J/mm and 0.88 J/mm LEDs. After the 50 μm depth,
the solidification rate for 0.29 J/mm LED decreased slowly. For 0.44 J/mm and 0.88 J/mm LEDs, the slope of
the solidification rate only changed after ~90 μm and then became stable at 50 mm/s.
4
6
The fast-moving laser in LPBF imparts a high cooling rate of 10 to 10 K/s [75-77] . Presently, a cooling rate of
10 K/s was noted in the Fe-30Mn-6Si LPBF-built alloy. The relationship between LED and the cooling rate
5
was observed in Figure 7C. From the surface of the melt pool, at 0 μm melt pool depth, the cooling rate was