
Page 57 - Read Online
P. 57
Dela Cruz et al. Microstructures 2023;3:2023012 https://dx.doi.org/10.20517/microstructures.2022.33 Page 17 of 25
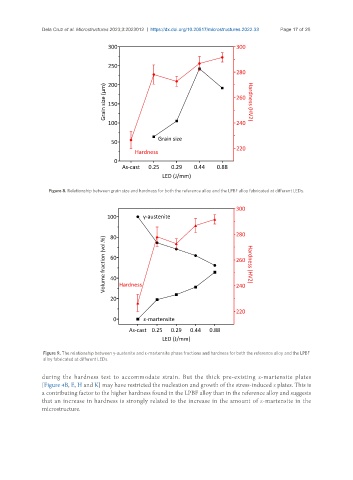
Figure 8. Relationship between grain size and hardness for both the reference alloy and the LPBF alloy fabricated at different LEDs.
Figure 9. The relationship between γ-austenite and ε-martensite phase fractions and hardness for both the reference alloy and the LPBF
alloy fabricated at different LEDs.
during the hardness test to accommodate strain. But the thick pre-existing ε-martensite plates
[Figure 4B, E, H and K] may have restricted the nucleation and growth of the stress-induced ε plates. This is
a contributing factor to the higher hardness found in the LPBF alloy than in the reference alloy and suggests
that an increase in hardness is strongly related to the increase in the amount of ε-martensite in the
microstructure.