
Page 44 - Read Online
P. 44
Page 4 of 25 Dela Cruz et al. Microstructures 2023;3:2023012 https://dx.doi.org/10.20517/microstructures.2022.33
Table 1. LPBF processing parameters used for the fabrication of Fe-30Mn-6Si alloy
Processing parameters Values
Laser power (W) 100, 125, 150, 175
Scan speed (mm/s) 400, 500, 600
Re-scan (%) 0, 50, 100
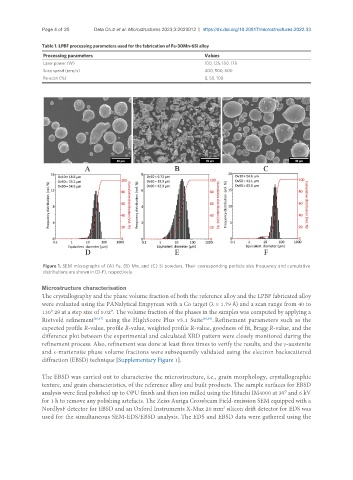
Figure 1. SEM micrographs of (A) Fe, (B) Mn, and (C) Si powders. Their corresponding particle size frequency and cumulative
distributions are shown in (D-F), respectively.
Microstructure characterisation
The crystallography and the phase volume fraction of both the reference alloy and the LPBF fabricated alloy
were evaluated using the PANalytical Empyrean with a Co target (λ = 1.79 Å) and a scan range from 40 to
130° 2θ at a step size of 0.02°. The volume fraction of the phases in the samples was computed by applying a
Rietveld refinement [36,37] using the HighScore Plus v5.1 Suite [38,39] . Refinement parameters such as the
expected profile R-value, profile R-value, weighted profile R-value, goodness of fit, Bragg R-value, and the
difference plot between the experimental and calculated XRD pattern were closely monitored during the
refinement process. Also, refinement was done at least three times to verify the results, and the γ-austenite
and ε-martensite phase volume fractions were subsequently validated using the electron backscattered
diffraction (EBSD) technique [Supplementary Figure 1].
The EBSD was carried out to characterise the microstructure, i.e., grain morphology, crystallographic
texture, and grain characteristics, of the reference alloy and built products. The sample surfaces for EBSD
analysis were final polished up to OPU finish and then ion milled using the Hitachi IM4000 at 30° and 6 kV
for 1 h to remove any polishing artefacts. The Zeiss Auriga Crossbeam Field-emission SEM equipped with a
NordlysF detector for EBSD and an Oxford Instruments X-Max 20 mm silicon drift detector for EDS was
2
used for the simultaneous SEM-EDS/EBSD analysis. The EDS and EBSD data were gathered using the