
Page 36 - Read Online
P. 36
Luo et al. Microstructures 2023;3:2023011 https://dx.doi.org/10.20517/microstructures.2022.41 Page 9 of 13
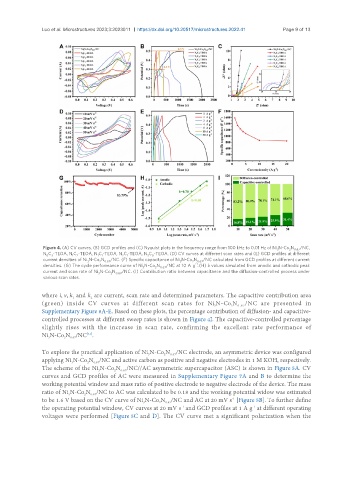
Figure 4. (A) CV curves, (B) GCD profiles and (C) Nyquist plots in the frequency range from 100 kHz to 0.01 Hz of Ni N-Co N /NC,
3 2 0.67
N C -TEOA, N C -TEOA, N C -TEOA, N C -TEOA, N C -TEOA. (D) CV curves at different scan rates and (E) GCD profiles at different
0 3 1 2 1 1 2 1 3 0
current densities of Ni N-Co N /NC. (F) Specific capacitance of Ni N-Co N /NC calculated from GCD profiles at different current
3 2 0.67 3 2 0.67
-1
densities. (G) The cycle performance curve of Ni N-Co N /NC at 10 A g . (H) b values simulated from anodic and cathodic peak
3 2 0.67
current and scan rate of Ni N-Co N /NC. (I) Contribution ratio between capacitance and the diffusion-controlled process under
3 2 0.67
various scan rates.
where i, v, k and k are current, scan rate and determined parameters. The capacitive contribution area
1
2
(green) inside CV curves at different scan rates for Ni N-Co N 0.67 /NC are presented in
3
2
Supplementary Figure 6A-E. Based on these plots, the percentage contribution of diffusion- and capacitive-
controlled processes at different sweep rates is shown in Figure 4I. The capacitive-controlled percentage
slightly rises with the increase in scan rate, confirming the excellent rate performance of
[51]
Ni N-Co N /NC .
0.67
3
2
To explore the practical application of Ni N-Co N /NC electrode, an asymmetric device was configured
0.67
2
3
applying Ni N-Co N /NC and active carbon as positive and negative electrodes in 1 M KOH, respectively.
3
0.67
2
The scheme of the Ni N-Co N /NC//AC asymmetric supercapacitor (ASC) is shown in Figure 5A. CV
2
0.67
3
curves and GCD profiles of AC were measured in Supplementary Figure 7A and B to determine the
working potential window and mass ratio of positive electrode to negative electrode of the device. The mass
ratio of Ni N-Co N /NC to AC was calculated to be 0.18 and the working potential widow was estimated
2
0.67
3
-1
to be 1.6 V based on the CV curve of Ni N-Co N /NC and AC at 20 mV s [Figure 5B]. To further define
0.67
2
3
-1
-1
the operating potential window, CV curves at 20 mV s and GCD profiles at 1 A g at different operating
voltages were performed [Figure 5C and D]. The CV curve met a significant polarization when the