
Page 35 - Read Online
P. 35
Page 8 of 13 Luo et al. Microstructures 2023;3:2023011 https://dx.doi.org/10.20517/microstructures.2022.41
[41]
groups, suggesting the successful establishment of nitrogen-doped carbon network . Nitrogen doping
could enhance the electrical conductivity of carbon, thus improving the energy storage performance of
Ni N-Co N 0.67 [42] .
2
3
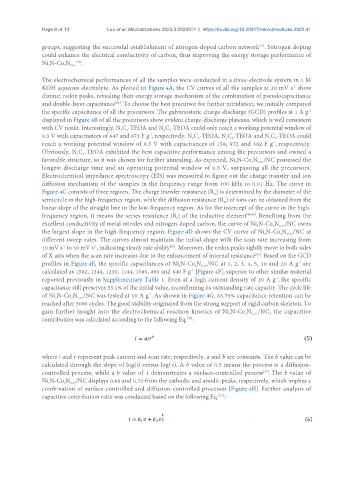
The electrochemical performances of all the samples were conducted in a three-electrode system in 1 M
KOH aqueous electrolyte. As plotted in Figure 4A, the CV curves of all the samples at 20 mV s show
-1
distinct redox peaks, revealing their energy storage mechanism of the combination of pseudocapacitance
and double-layer capacitance . To choose the best precursor for further nitridation, we initially compared
[43]
-1
the specific capacitance of all the precursors. The galvanostatic charge-discharge (GCD) profiles at 1 A g
displayed in Figure 4B of all the precursors show evident charge-discharge plateaus, which is well consistent
with CV result. Interestingly, N C -TEOA and N C -TEOA could only reach a working potential window of
1 1
2 1
0.3 V with capacitances of 647 and 873 F g , respectively. N C -TEOA, N C -TEOA and N C -TEOA could
-1
0
3
1
2
0
3
reach a working potential window of 0.5 V with capacitances of 158, 972 and 382 F g , respectively.
-1
Obviously, N C -TEOA exhibited the best capacitive performance among the precursors and owned a
1
2
favorable structure, so it was chosen for further annealing. As expected, Ni N-Co N /NC possessed the
0.67
3
2
longest discharge time and an operating potential window of 0.5 V, surpassing all the precursors.
Electrochemical impedance spectroscopy (EIS) was measured to figure out the charge transfer and ion
diffusion mechanism of the samples in the frequency range from 100 kHz to 0.01 Hz. The curve in
Figure 4C consists of three regions. The charge transfer resistance (R ) is determined by the diameter of the
ct
semicircle in the high-frequency region, while the diffusion resistance (R ) of ions can be obtained from the
w
linear slope of the straight line in the low-frequency region. As for the intercept of the curve in the high-
frequency region, it means the series resistance (R ) of the inductive element [44,45] . Benefiting from the
s
excellent conductivity of metal nitrides and nitrogen-doped carbon, the curve of Ni N-Co N /NC owns
3
0.67
2
the largest slope in the high-frequency region. Figure 4D shows the CV curve of Ni N-Co N /NC at
0.67
3
2
different sweep rates. The curves almost maintain the initial shape with the scan rate increasing from
10 mV s to 50 mV s , indicating steady rate ability . Moreover, the redox peaks sightly move to both sides
[46]
-1
-1
[47]
of X axis when the scan rate increases due to the enhancement of internal resistance . Based on the GCD
profiles in Figure 4E, the specific capacitances of Ni N-Co N /NC at 1, 2, 3, 4, 5, 10 and 20 A g are
-1
0.67
2
3
calculated as 1582, 1344, 1230, 1144, 1080, 860 and 840 F g [Figure 4F], superior to other similar material
-1
reported previously in Supplementary Table 1. Even at a high current density of 20 A g , the specific
-1
capacitance still preserves 53.1% of the initial value, reconfirming its outstanding rate capacity. The cycle life
-1
of Ni N-Co N /NC was tested at 10 A g . As shown in Figure 4G, 83.79% capacitance retention can be
0.67
2
3
reached after 5000 cycles. The good stability originated from the strong support of rigid carbon skeleton. To
gain further insight into the electrochemical reaction kinetics of Ni N-Co N /NC, the capacitive
0.67
3
2
contribution was calculated according to the following Eq. :
[48]
where i and v represent peak current and scan rate, respectively. a and b are constants. The b value can be
calculated through the slope of log(i) versus log(v). A b value of 0.5 means the process is a diffusion-
[49]
controlled process, while a b value of 1 demonstrates a surface-controlled process . The b value of
Ni N-Co N /NC displays 0.68 and 0.70 from the cathodic and anodic peaks, respectively, which implies a
2
3
0.67
combination of surface-controlled and diffusion-controlled processes [Figure 4H]. Further analysis of
capacitive contribution ratio was conducted based on the following Eq. :
[50]