Page 33 - Read Online
P. 33

Page 6 of 13          Luo et al. Microstructures 2023;3:2023011  https://dx.doi.org/10.20517/microstructures.2022.41


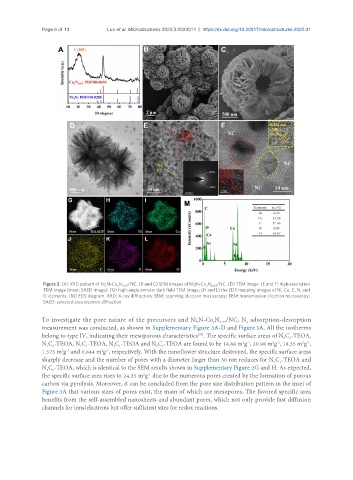
                Figure 2. (A) XRD pattern of Ni N-Co N 0.67 /NC. (B and C) SEM images of Ni N-Co N 0.67 /NC. (D) TEM image. (E and F) high-resolution
                                    3
                                                                      2
                                                                  3
                                         2
                TEM image (Inset: SAED image). (G) high-angle annular dark field TEM image. (H and L) the EDS mapping images of Ni, Co, C, N, and
                O elements. (M) EDS diagram. XRD: X-ray diffraction; SEM: scanning electron microscopy; TEM: transmission electron microscopy;
                SAED: selected area electron diffraction.
               To investigate the pore nature of the precursors and Ni N-Co N /NC, N  adsorption-desorption
                                                                           0.67
                                                                         2
                                                                                    2
                                                                   3
               measurement was conducted, as shown in Supplementary Figure 3A-D and Figure 3A. All the isotherms
               belong to type IV, indicating their mesoporous characteristics . The specific surface areas of N C -TEOA,
                                                                    [32]
                                                                                                 0
                                                                                                   3
                                                                                             2 -1
               N C -TEOA, N C -TEOA, N C -TEOA and N C -TEOA are found to be 18.88 m g , 20.98 m g , 18.35 m g ,
                                                                                                       2 -1
                                                                                   2 -1
                                                      3 0
                                       2 1
                 1 2
                            1 1
               1.573 m g  and 0.844 m g , respectively. With the nanoflower structure destroyed, the specific surface areas
                      2 -1
                                   2 -1
               sharply decrease and the number of pores with a diameter larger than 30 nm reduces for N C -TEOA and
                                                                                             2
                                                                                               1
               N C -TEOA, which is identical to the SEM results shown in Supplementary Figure 2G and H. As expected,
                   0
                 3
                                                 2 -1
               the specific surface area rises to 24.35 m g  due to the numerous pores created by the formation of porous
               carbon via pyrolysis. Moreover, it can be concluded from the pore size distribution pattern in the inset of
               Figure 3A that various sizes of pores exist, the main of which are mesopores. The favored specific area
               benefits from the self-assembled nanosheets and abundant pores, which not only provide fast diffusion
               channels for ions/electrons but offer sufficient sites for redox reactions.
   28   29   30   31   32   33   34   35   36   37   38