
Page 34 - Read Online
P. 34
Luo et al. Microstructures 2023;3:2023011 https://dx.doi.org/10.20517/microstructures.2022.41 Page 7 of 13
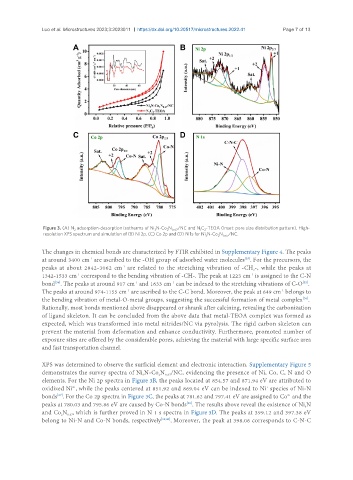
Figure 3. (A) N adsorption-desorption isotherms of Ni N-Co N /NC and N C -TEOA (Inset: pore size distribution pattern). High-
2 3 2 0.67 1 2
resolution XPS spectrum and simulation of (B) Ni 2p, (C) Co 2p and (D) N 1s for Ni N-Co N /NC.
3 2 0.67
The changes in chemical bonds are characterized by FTIR exhibited in Supplementary Figure 4. The peaks
at around 3400 cm are ascribed to the -OH group of adsorbed water molecules . For the precursors, the
-1
[33]
-1
peaks at about 2842-3062 cm are related to the stretching vibration of -CH -, while the peaks at
2
-1
1342-1533 cm correspond to the bending vibration of -CH-. The peak at 1223 cm is assigned to the C-N
-1
[34]
[35]
-1
-1
bond . The peaks at around 917 cm and 1633 cm can be indexed to the stretching vibrations of C-O .
The peaks at around 974-1155 cm are ascribed to the C-C bond. Moreover, the peak at 649 cm belongs to
-1
-1
the bending vibration of metal-O-metal groups, suggesting the successful formation of metal complex .
[36]
Rationally, most bonds mentioned above disappeared or shrank after calcining, revealing the carbonization
of ligand skeleton. It can be concluded from the above data that metal-TEOA complex was formed as
expected, which was transformed into metal nitrides/NC via pyrolysis. The rigid carbon skeleton can
prevent the material from deformation and enhance conductivity. Furthermore, promoted number of
exposure sites are offered by the considerable pores, achieving the material with large specific surface area
and fast transportation channel.
XPS was determined to observe the surficial element and electronic interaction. Supplementary Figure 5
demonstrates the survey spectra of Ni N-Co N /NC, evidencing the presence of Ni, Co, C, N and O
2
0.67
3
elements. For the Ni 2p spectra in Figure 3B, the peaks located at 854.57 and 871.94 eV are attributed to
oxidized Ni , while the peaks centered at 851.92 and 869.04 eV can be indexed to Ni species of Ni-N
+
2+
bonds . For the Co 2p spectra in Figure 3C, the peaks at 781.62 and 797.41 eV are assigned to Co and the
2+
[37]
peaks at 780.03 and 795.86 eV are caused by Co-N bonds . The results above reveal the existence of Ni N
[38]
3
and Co N , which is further proved in N 1 s spectra in Figure 3D. The peaks at 399.12 and 397.38 eV
0.67
2
belong to Ni-N and Co-N bonds, respectively [39,40] . Moreover, the peak at 398.06 corresponds to C-N-C