
Page 32 - Read Online
P. 32
Luo et al. Microstructures 2023;3:2023011 https://dx.doi.org/10.20517/microstructures.2022.41 Page 5 of 13
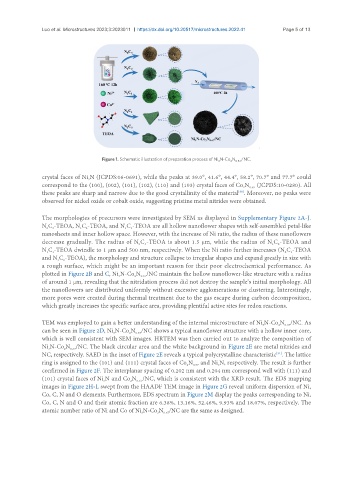
Figure 1. Schematic illustration of preparation process of Ni N-Co N /NC.
3 2 0.67
crystal faces of Ni N (JCPDS:06-0691), while the peaks at 39.0°, 41.6°, 44.4°, 58.2°, 70.7° and 77.7° could
3
correspond to the (100), (002), (101), (102), (110) and (103) crystal faces of Co N (JCPDS:10-0280). All
2
0.67
these peaks are sharp and narrow due to the good crystallinity of the material . Moreover, no peaks were
[30]
observed for nickel oxide or cobalt oxide, suggesting pristine metal nitrides were obtained.
The morphologies of precursors were investigated by SEM as displayed in Supplementary Figure 2A-J.
N C -TEOA, N C -TEOA, and N C -TEOA are all hollow nanoflower shapes with self-assembled petal-like
1
1
2
0 3
1
nanosheets and inner hollow space. However, with the increase of Ni ratio, the radius of these nanoflowers
decrease gradually. The radius of N C -TEOA is about 1.5 μm, while the radius of N C -TEOA and
1
2
0
3
N C -TEOA dwindle to 1 μm and 500 nm, respectively. When the Ni ratio further increases (N C -TEOA
1 1
1
2
and N C -TEOA), the morphology and structure collapse to irregular shapes and expand greatly in size with
3 0
a rough surface, which might be an important reason for their poor electrochemical performance. As
plotted in Figure 2B and C, Ni N-Co N /NC maintain the hollow nanoflower-like structure with a radius
2
0.67
3
of around 1 μm, revealing that the nitridation process did not destroy the sample’s initial morphology. All
the nanoflowers are distributed uniformly without excessive agglomerations or clustering. Interestingly,
more pores were created during thermal treatment due to the gas escape during carbon decomposition,
which greatly increases the specific surface area, providing plentiful active sites for redox reactions.
TEM was employed to gain a better understanding of the internal microstructure of Ni N-Co N /NC. As
2
0.67
3
can be seen in Figure 2D, Ni N-Co N /NC shows a typical nanoflower structure with a hollow inner core,
0.67
2
3
which is well consistent with SEM images. HRTEM was then carried out to analyze the composition of
Ni N-Co N /NC. The black circular area and the white background in Figure 2E are metal nitrides and
0.67
2
3
NC, respectively. SAED in the inset of Figure 2E reveals a typical polycrystalline characteristic . The lattice
[31]
ring is assigned to the (101) and (111) crystal faces of Co N and Ni N, respectively. The result is further
3
0.67
2
confirmed in Figure 2F. The interplanar spacing of 0.202 nm and 0.204 nm correspond well with (111) and
(101) crystal faces of Ni N and Co N /NC, which is consistent with the XRD result. The EDS mapping
0.67
2
3
images in Figure 2H-L swept from the HAADF TEM image in Figure 2G reveal uniform dispersion of Ni,
Co, C, N and O elements. Furthermore, EDS spectrum in Figure 2M display the peaks corresponding to Ni,
Co, C, N and O and their atomic fraction are 6.38%, 13.16%, 52.46%, 9.93% and 18.07%, respectively. The
atomic number ratio of Ni and Co of Ni N-Co N /NC are the same as designed.
2
3
0.67