
Page 92 - Read Online
P. 92
Page 6 of 13 Liu et al. Microstructures 2023;3:2023008 https://dx.doi.org/10.20517/microstructures.2022.31
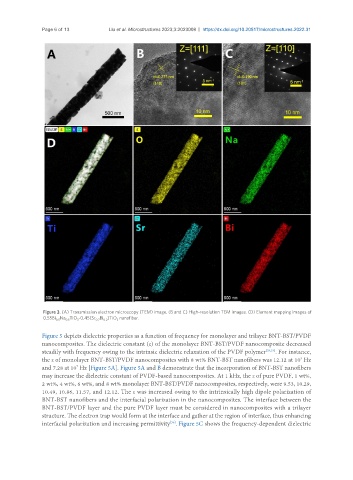
Figure 3. (A) Transmission electron microscopy (TEM) image. (B and C) High-resolution TEM images. (D) Element mapping images of
0.55Bi Na TiO -0.45(Sr Bi )TiO nanofiber.
3
0.2
0.7
0.5
0.5
3
Figure 5 depicts dielectric properties as a function of frequency for monolayer and trilayer BNT-BST/PVDF
nanocomposites. The dielectric constant (ε) of the monolayer BNT-BST/PVDF nanocomposite decreased
steadily with frequency owing to the intrinsic dielectric relaxation of the PVDF polymer [29,33] . For instance,
the ε of monolayer BNT-BST/PVDF nanocomposites with 8 wt% BNT-BST nanofibers was 12.12 at 10 Hz
3
and 7.28 at 10 Hz [Figure 5A]. Figure 5A and B demonstrate that the incorporation of BNT-BST nanofibers
7
may increase the dielectric constant of PVDF-based nanocomposites. At 1 kHz, the ε of pure PVDF, 1 wt%,
2 wt%, 4 wt%, 6 wt%, and 8 wt% monolayer BNT-BST/PVDF nanocomposites, respectively, were 9.53, 10.29,
10.49, 10.86, 11.57, and 12.12. The ε was increased owing to the intrinsically high dipole polarization of
BNT-BST nanofibers and the interfacial polarization in the nanocomposites. The interface between the
BNT-BST/PVDF layer and the pure PVDF layer must be considered in nanocomposites with a trilayer
structure. The electron trap would form at the interface and gather at the region of interface, thus enhancing
interfacial polarization and increasing permittivity . Figure 5C shows the frequency-dependent dielectric
[36]