
Page 96 - Read Online
P. 96
Page 10 of 13 Liu et al. Microstructures 2023;3:2023008 https://dx.doi.org/10.20517/microstructures.2022.31
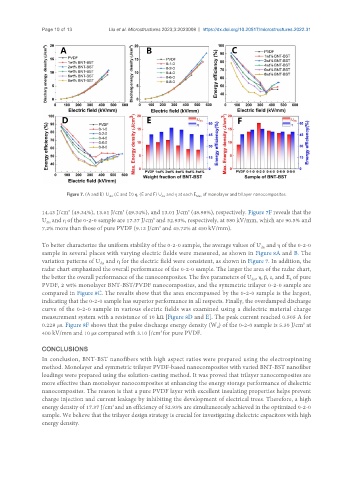
Figure 7. (A and B) U , (C and D) η, (E and F) U and η at each E Max of monolayer and trilayer nanocomposites.
dis
dis
14.43 J/cm (49.34%), 13.61 J/cm (49.34%), and 13.01 J/cm (48.98%), respectively. Figure 7F reveals that the
3
3
3
U and η of the 0-2-0 sample are 17.37 J/cm and 52.93%, respectively, at 580 kV/mm, which are 90.5% and
3
dis
3
7.2% more than those of pure PVDF (9.12 J/cm and 45.72% at 450 kV/mm).
To better characterize the uniform stability of the 0-2-0 sample, the average values of U and η of the 0-2-0
dis
sample in several places with varying electric fields were measured, as shown in Figure 8A and B. The
variation patterns of U and η for the electric field were consistent, as shown in Figure 7. In addition, the
dis
radar chart emphasized the overall performance of the 0-2-0 sample. The larger the area of the radar chart,
the better the overall performance of the nanocomposites. The five parameters of U , η, β, ε, and E of pure
b
dis
PVDF, 2 wt% monolayer BNT-BST/PVDF nanocomposites, and the symmetric trilayer 0-2-0 sample are
compared in Figure 8C. The results show that the area encompassed by the 0-2-0 sample is the largest,
indicating that the 0-2-0 sample has superior performance in all respects. Finally, the overdamped discharge
curve of the 0-2-0 sample in various electric fields was examined using a dielectric material charge
measurement system with a resistance of 10 kΩ [Figure 8D and E]. The peak current reached 0.505 A for
0.228 μs. Figure 8F shows that the pulse discharge energy density (W ) of the 0-2-0 sample is 5.30 J/cm at
3
d
400 kV/mm and 10 μs compared with 3.10 J/cm for pure PVDF.
3
CONCLUSIONS
In conclusion, BNT-BST nanofibers with high aspect ratios were prepared using the electrospinning
method. Monolayer and symmetric trilayer PVDF-based nanocomposites with varied BNT-BST nanofiber
loadings were prepared using the solution-casting method. It was proved that trilayer nanocomposites are
more effective than monolayer nanocomposites at enhancing the energy storage performance of dielectric
nanocomposites. The reason is that a pure PVDF layer with excellent insulating properties helps prevent
charge injection and current leakage by inhibiting the development of electrical trees. Therefore, a high
energy density of 17.37 J/cm and an efficiency of 52.93% are simultaneously achieved in the optimized 0-2-0
3
sample. We believe that the trilayer design strategy is crucial for investigating dielectric capacitors with high
energy density.