
Page 91 - Read Online
P. 91
Liu et al. Microstructures 2023;3:2023008 https://dx.doi.org/10.20517/microstructures.2022.31 Page 5 of 13
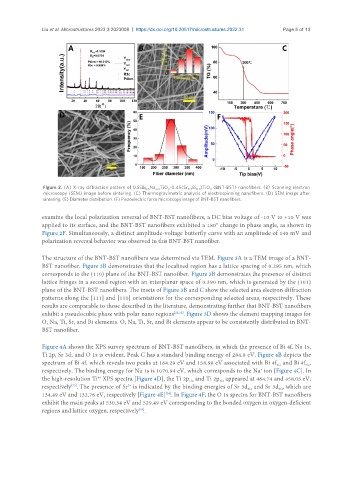
Figure 2. (A) X-ray diffraction pattern of 0.55Bi Na TiO -0.45(Sr Bi )TiO (BNT-BST) nanofibers. (B) Scanning electron
0.5
0.7
3
3
0.2
0.5
microscopy (SEM) image before sintering. (C) Thermogravimetric analysis of electrospinning nanofibers. (D) SEM image after
sintering. (E) Diameter distribution. (F) Piezoelectric force microscopy image of BNT-BST nanofibers.
examine the local polarization reversal of BNT-BST nanofibers, a DC bias voltage of -10 V to +10 V was
applied to its surface, and the BNT-BST nanofibers exhibited a 180° change in phase angle, as shown in
Figure 2F. Simultaneously, a distinct amplitude-voltage butterfly curve with an amplitude of 140 mV and
polarization reversal behavior was observed in this BNT-BST nanofiber.
The structure of the BNT-BST nanofibers was determined via TEM. Figure 3A is a TEM image of a BNT-
BST nanofiber. Figure 3B demonstrates that the localized region has a lattice spacing of 0.295 nm, which
corresponds to the (110) plane of the BNT-BST nanofiber. Figure 3B demonstrates the presence of distinct
lattice fringes in a second region with an interplanar space of 0.390 nm, which is generated by the (101)
plane of the BNT-BST nanofibers. The insets of Figure 3B and C show the selected area electron diffraction
patterns along the [111] and [110] orientations for the corresponding selected areas, respectively. These
results are comparable to those described in the literature, demonstrating further that BNT-BST nanofibers
exhibit a pseudocubic phase with polar nano regions [22,32] . Figure 3D shows the element mapping images for
O, Na, Ti, Sr, and Bi elements. O, Na, Ti, Sr, and Bi elements appear to be consistently distributed in BNT-
BST nanofiber.
Figure 4A shows the XPS survey spectrum of BNT-BST nanofibers, in which the presence of Bi 4f, Na 1s,
Ti 2p, Sr 3d, and O 1s is evident. Peak C has a standard binding energy of 284.8 eV. Figure 4B depicts the
spectrum of Bi 4f, which reveals two peaks at 164.29 eV and 158.98 eV associated with Bi 4f and Bi 4f ,
5/2
7/2
respectively. The binding energy for Na 1s is 1070.94 eV, which corresponds to the Na ion [Figure 4C]. In
+
4+
the high-resolution Ti XPS spectra [Figure 4D], the Ti 2p and Ti 2p appeared at 464.74 and 458.05 eV,
3/2
1/2
respectively . The presence of Sr is indicated by the binding energies of Sr 3d and Sr 3d , which are
[33]
2+
3/2
5/2
[34]
134.49 eV and 132.76 eV, respectively [Figure 4E] . In Figure 4F, the O 1s spectra for BNT-BST nanofibers
exhibit the main peaks at 530.34 eV and 529.49 eV corresponding to the bonded oxygen in oxygen-deficient
regions and lattice oxygen, respectively .
[35]