
Page 83 - Read Online
P. 83
Li et al. Microstructures 2023;3:2023007 https://dx.doi.org/10.20517/microstructures.2022.27 Page 7 of 10
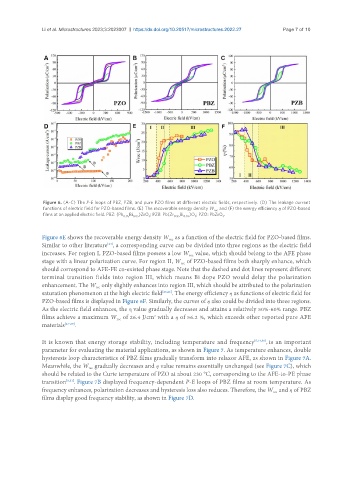
Figure 6. (A-C) The P-E loops of PBZ, PZB, and pure PZO films at different electric fields, respectively. (D) The leakage current
functions of electric field for PZO-based films. (E) The recoverable energy density W and (F) the energy efficiency η of PZO-based
rec
films at an applied electric field. PBZ: (Pb Bi )ZrO ; PZB: Pb(Zr Bi )O ; PZO: PbZrO .
0.95 0.05 3 0.95 0.05 3 3
Figure 6E shows the recoverable energy density W as a function of the electric field for PZO-based films.
rec
Similar to other literature , a corresponding curve can be divided into three regions as the electric field
[24]
increases. For region I, PZO-based films possess a low W value, which should belong to the AFE phase
rec
stage with a linear polarization curve. For region II, W of PZO-based films both sharply enhance, which
rec
should correspond to AFE-FE co-existed phase stage. Note that the dashed and dot lines represent different
terminal transition fields into region III, which means Bi dope PZO would delay the polarization
enhancement. The W only slightly enhances into region III, which should be attributed to the polarization
rec
saturation phenomenon at the high electric field [25,26] . The energy efficiency η as functions of electric field for
PZO-based films is displayed in Figure 6F. Similarly, the curves of η also could be divided into three regions.
As the electric field enhances, the η value gradually decreases and attains a relatively 50%-60% range. PBZ
films achieve a maximum W of 26.4 J/cm with a η of 56.2 %, which exceeds other reported pure AFE
3
rec
materials [27-29] .
It is known that energy storage stability, including temperature and frequency [5,14,30] , is an important
parameter for evaluating the material applications, as shown in Figure 7. As temperature enhances, double
hysteresis loop characteristics of PBZ films gradually transform into relaxor AFE, as shown in Figure 7A.
Meanwhile, the W gradually decreases and η value remains essentially unchanged (see Figure 7C), which
rec
should be related to the Curie temperature of PZO at about 230 °C, corresponding to the AFE-to-PE phase
transition [8,31] . Figure 7B displayed frequency-dependent P-E loops of PBZ films at room temperature. As
frequency enhances, polarization decreases and hysteresis loss also reduces. Therefore, the W and η of PBZ
rec
films display good frequency stability, as shown in Figure 7D.