
Page 132 - Read Online
P. 132
Prescott et al. Vessel Plus 2019;3:13 I http://dx.doi.org/10.20517/2574-1209.2018.70 Page 3 of 10
A B
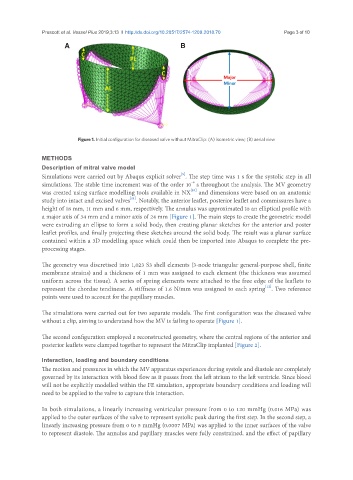
Figure 1. Initial configuration for diseased valve without MitraClip: (A) isometric view; (B) aerial view
METHODS
Description of mitral valve model
[9]
Simulations were carried out by Abaqus explicit solver . The step time was 1 s for the systolic step in all
-6
simulations. The stable time increment was of the order 10 s throughout the analysis. The MV geometry
[10]
was created using surface modelling tools available in NX and dimensions were based on an anatomic
[11]
study into intact and excised valves . Notably, the anterior leaflet, posterior leaflet and commissures have a
height of 18 mm, 11 mm and 6 mm, respectively. The annulus was approximated to an elliptical profile with
a major axis of 34 mm and a minor axis of 24 mm [Figure 1]. The main steps to create the geometric model
were extruding an ellipse to form a solid body, then creating planar sketches for the anterior and poster
leaflet profiles, and finally projecting these sketches around the solid body. The result was a planar surface
contained within a 3D modelling space which could then be imported into Abaqus to complete the pre-
processing stages.
The geometry was discretised into 1,023 S3 shell elements (3-node triangular general-purpose shell, finite
membrane strains) and a thickness of 1 mm was assigned to each element (the thickness was assumed
uniform across the tissue). A series of spring elements were attached to the free edge of the leaflets to
[12]
represent the chordae tendineae. A stiffness of 1.6 N/mm was assigned to each spring . Two reference
points were used to account for the papillary muscles.
The simulations were carried out for two separate models. The first configuration was the diseased valve
without a clip, aiming to understand how the MV is failing to operate [Figure 1].
The second configuration employed a reconstructed geometry, where the central regions of the anterior and
posterior leaflets were clamped together to represent the MitraClip implanted [Figure 2].
Interaction, loading and boundary conditions
The motion and pressures in which the MV apparatus experiences during systole and diastole are completely
governed by its interaction with blood flow as it passes from the left atrium to the left ventricle. Since blood
will not be explicitly modelled within the FE simulation, appropriate boundary conditions and loading will
need to be applied to the valve to capture this interaction.
In both simulations, a linearly increasing ventricular pressure from 0 to 120 mmHg (0.016 MPa) was
applied to the outer surfaces of the valve to represent systolic peak during the first step. In the second step, a
linearly increasing pressure from 0 to 5 mmHg (0.0007 MPa) was applied to the inner surfaces of the valve
to represent diastole. The annulus and papillary muscles were fully constrained, and the effect of papillary