
Page 135 - Read Online
P. 135
Page 6 of 10 Prescott et al. Vessel Plus 2019;3:13 I http://dx.doi.org/10.20517/2574-1209.2018.70
A B
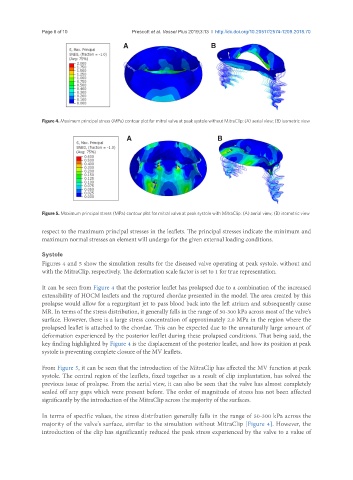
Figure 4. Maximum principal stress (MPa) contour plot for mitral valve at peak systole without MitraClip: (A) aerial view; (B) isometric view
A B
Figure 5. Maximum principal stress (MPa) contour plot for mitral valve at peak systole with MitraClip: (A) aerial view; (B) isometric view
respect to the maximum principal stresses in the leaflets. The principal stresses indicate the minimum and
maximum normal stresses an element will undergo for the given external loading conditions.
Systole
Figures 4 and 5 show the simulation results for the diseased valve operating at peak systole, without and
with the MitraClip, respectively. The deformation scale factor is set to 1 for true representation.
It can be seen from Figure 4 that the posterior leaflet has prolapsed due to a combination of the increased
extensibility of HOCM leaflets and the ruptured chordae presented in the model. The area created by this
prolapse would allow for a regurgitant jet to pass blood back into the left atrium and subsequently cause
MR. In terms of the stress distribution, it generally falls in the range of 50-300 kPa across most of the valve’s
surface. However, there is a large stress concentration of approximately 2.0 MPa in the region where the
prolapsed leaflet is attached to the chordae. This can be expected due to the unnaturally large amount of
deformation experienced by the posterior leaflet during these prolapsed conditions. That being said, the
key finding highlighted by Figure 4 is the displacement of the posterior leaflet, and how its position at peak
systole is preventing complete closure of the MV leaflets.
From Figure 5, it can be seen that the introduction of the MitraClip has affected the MV function at peak
systole. The central region of the leaflets, fixed together as a result of clip implantation, has solved the
previous issue of prolapse. From the aerial view, it can also be seen that the valve has almost completely
sealed off any gaps which were present before. The order of magnitude of stress has not been affected
significantly by the introduction of the MitraClip across the majority of the surfaces.
In terms of specific values, the stress distribution generally falls in the range of 50-300 kPa across the
majority of the valve’s surface, similar to the simulation without MitraClip [Figure 4]. However, the
introduction of the clip has significantly reduced the peak stress experienced by the valve to a value of