
Page 97 - Read Online
P. 97
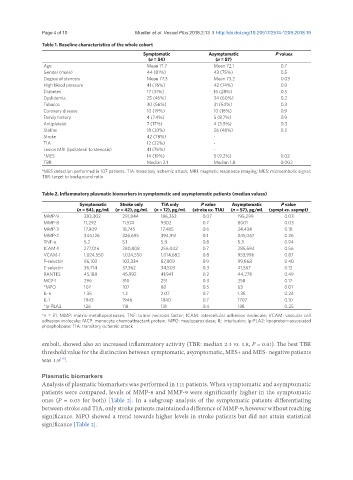
Page 4 of 10                                                     Mueller et al. Vessel Plus 2018;2:13  I  http://dx.doi.org/10.20517/2574-1209.2018.19

               Table 1. Baseline characteristics of the whole cohort
                                                 Symptomatic           Asymptomatic           P values
                                                   (n = 54)               (n = 57)
                Age                                Mean 71.7             Mean 72.1              0.7
                Gender (male)                      44 (81%)              43 (75%)               0.5
                Degree of stenosis                 Mean 77.3             Mean 73.2              0.03
                High blood pressure                41 (76%)              42 (74%)               0.9
                Diabetes                           17 (31%)              16 (28%)               0.5
                Dyslidemia                         25 (46%)              34 (60%)               0.2
                Tobacco                            30 (56%)              31 (54%)               0.3
                Coronary disease                   10 (19%)              10 (18%)               0.9
                Family history                     4 (7.4%)              5 (8.7%)               0.9
                Antiplatelet                       7 (17%)               4 (3.5%)               0.3
                Statins                            18 (33%)              26 (48%)               0.2
                Stroke                             42 (78%)              -
                TIA                                12 (22%)              -
                Lesion MRI (ipsilateral to stenosis)  41 (76%)           -
                *MES                               14 (19%)              5 (9.2%)               0.02
                TBR                                Median 2.1            Median 1.8             0.002
               *MES detection performed in 107 patients. TIA: transitory ischemic attack; MRI: magnetic resonance imaging; MES: microembolic signal;
               TBR: target to background ratio


               Table 2. Inflammatory plasmatic biomarkers in symptomatic and asymptomatic patients (median values)
                            Symptomatic   Stroke only  TIA only      P value   Asymptomatic     P value
                           (n = 54), pg/mL  (n = 42), pg/mL  (n = 12), pg/mL  (stroke vs. TIA)  (n = 57), pg/mL  (sympt vs. asympt)
                MMP-9        283,302      291,844      186,353       0.07        195,299         0.03
                MMP-8        11,292       11,574       9302          0.7         8001            0.03
                MMP-3        17,909       18,745       17,485        0.6         24,434          0.18
                MMP-2        344,126      326,695      394,951       0.1         345,067         0.26
                TNF-α        5.2          5.1          5.8           0.8         5.3             0.94
                ICAM-1       277,016      280,808      256,042       0.7         285,594         0.56
                VCAM-1       1,024,550    1,024,550    1,014,682     0.8         953,996         0.87
                P-selectin   96,102       102,334      87,809        0.9         99,868          0.40
                E-selectin   36,714       37,362       34,503        0.3         41,567          0.12
                RANTES       45,188       45,992       41,941        0.2         44,278          0.49
                MCP-1        296          310          251           0.3         258             0.17
                *MPO         107          107          80            0.5         63              0.07
                IL-6         1.35         1.3          2.07          0.7         1.35            0.24
                IL-1         1943         1946         1840          0.7         1707            0.10
                *lp-PLA2     126          118          131           0.4         138             0.25
               *n = 51. MMP: matrix-metalloproteases; TNF: tumor necrosis factor; ICAM: intercellular adhesion molecule; VCAM: vascular cell
               adhesion molecule; MCP: monocyte chemoattractant protein; MPO: myeloperoxidase; IL: interleukin; lp-PLA2: lipoprotein-associated
               phospholipase; TIA: transitory ischemic attack

               emboli, showed also an increased inflammatory activity (TBR: median 2.3 vs. 1.8, P = 0.01). The best TBR
               threshold value for the distinction between symptomatic, asymptomatic, MES+ and MES- negative patients
               was 1.9 .
                     [13]
               Plasmatic biomarkers
               Analysis of plasmatic biomarkers was performed in 111 patients. When symptomatic and asymptomatic
               patients were compared, levels of MMP-8 and MMP-9 were significantly higher in the symptomatic
               ones (P = 0.03 for both) [Table 2]. In a subgroup analysis of the symptomatic patients differentiating
               between stroke and TIA, only stroke patients maintained a difference of MMP-9, however without reaching
               significance. MPO showed a trend towards higher levels in stroke patients but did not attain statistical
               significance [Table 2].