
Page 159 - Read Online
P. 159
Purkait et al. Vessel Plus 2018;2:19 I http://dx.doi.org/10.20517/2574-1209.2018.16 Page 5 of 10
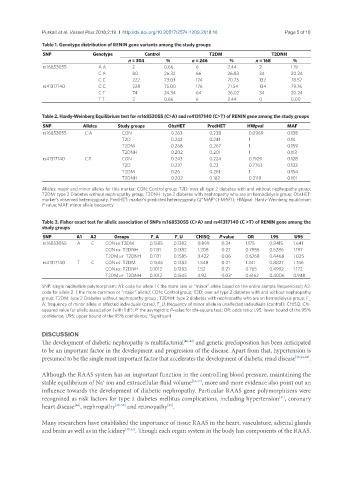
Table 1. Genotype distribution of RENIN gene variants among the study groups
SNP Genotype Control T2DM T2DNH
n = 304 % n = 246 % n = 168 %
rs16853055 A A 2 0.66 6 2.44 2 1.19
C A 80 26.32 66 26.83 34 20.24
C C 222 73.03 174 70.73 132 78.57
rs41317140 C C 228 75.00 176 71.54 134 79.76
C T 74 24.34 64 26.02 34 20.24
T T 2 0.66 6 2.44 0 0.00
Table 2. Hardy-Weinberg Equilibrium test for rs16853055 (C>A) and rs41317140 (C>T) of RENIN gene among the study groups
SNP Alleles Study groups ObsHET PredHET HWpval MAF
rs16853055 C:A CON 0.263 0.238 0.0969 0.138
T2D 0.242 0.241 1 0.14
T2DM 0.268 0.267 1 0.159
T2DNH 0.202 0.201 1 0.113
rs41317140 C:T CON 0.243 0.224 0.1929 0.128
T2D 0.237 0.23 0.7763 0.133
T2DM 0.26 0.261 1 0.154
T2DNH 0.202 0.182 0.3119 0.101
Alleles: major and minor alleles for this marker; CON: Control group; T2D: over all type 2 diabetes with and without nephropathy group;
T2DM: type 2 Diabetes without nephropathy group; T2DNH: type 2 diabetes with nephropathy who are on hemodialysis group; ObsHET:
marker’s observed heterozygosity; PredHET: marker's predicted heterozygosity (2*MAF*(1-MAF)); HWpval: Hardy-Weinberg equilibrium
P value; MAF: minor allele frequency
Table 3. Fisher exact test for allelic association of SNPs rs16853055 (C>A) and rs41317140 (C >T) of RENIN gene among the
study groups
SNP A1 A2 Groups F_A F_U CHISQ P value OR L95 U95
rs16853055 A C CON vs.T2DM 0.1585 0.1382 0.899 0.34 1.175 0.8415 1.641
CON vs. T2DNH 0.1131 0.1382 1.208 0.27 0.7955 0.5286 1.197
T2DM vs. T2DNH 0.1131 0.1585 3.422 0.06 0.6768 0.4468 1.025
rs41317140 T C CON vs. T2DM 0.1545 0.1283 1.548 0.21 1.241 0.8827 1.746
CON vs. T2DNH 0.1012 0.1283 1.52 0.21 0.765 0.4992 1.172
T2DM vs. T2DNH 0.1012 0.1545 4.92 0.03* 0.6162 0.4006 0.948
SNP: single nucleotide polymorphism; A1: code for allele 1 ( the more rare or “minor” allele based on the entire sample frequencies); A2:
code for allele 2 ( the more common or “major” allele); CON: Control group; T2D: over all type 2 diabetes with and without nephropathy
group; T2DM: type 2 Diabetes without nephropathy group ; T2DNH: type 2 diabetes with nephropathy who are on hemodialysis group; F_
A: frequency of minor allele in affected individuals (case); F_U: frequency of minor allele in unaffected individuals (control); CHISQ: Chi-
squared value for allelic association (with 1 df); P: the asymptotic P-value for chi-square test; OR: odds ratio; L95: lower bound of the 95%
confidence; U95: upper bound of the 95% confidence; *Significant
DISCUSSION
The development of diabetic nephropathy is multifactorial [40-43] and genetic predisposition has been anticipated
to be an important factor in the development and progression of the disease. Apart from that, hypertension is
presumed to be the single most important factor that accelerates the development of diabetic renal disease [25,44,45] .
Although the RAAS system has an important function in the controlling blood pressure, maintaining the
stable equilibrium of Na ion and extracellular fluid volume [46,47] , more and more evidence also point out an
+
influence towards the development of diabetic nephropathy. Particular RAAS gene polymorphisms were
recognized as risk factors for type 2 diabetes mellitus complications, including hypertension , coronary
[31]
heart disease , nephropathy [48-50] and retinopathy .
[51]
[48]
Many researchers have established the importance of tissue RAAS in the heart, vasculature, adrenal glands
and brain as well as in the kidney [52,53] . Though each organ system in the body has components of the RAAS,