
Page 157 - Read Online
P. 157
Purkait et al. Vessel Plus 2018;2:19 I http://dx.doi.org/10.20517/2574-1209.2018.16 Page 3 of 10
Ethical committee clearance was obtained from the medical institutions prior to the recruitment of subjects in
this study. An informed consent was obtained from all the participants prior to their recruitment for the study.
The study included 168 type 2 diabetic patients with nephropathy cases on hemodialysis (T2DNH), 246
type 2 diabetes patients without nephropathy cases (T2DM) and 304 controls (CON). The identification of
type 2 diabetic and nephropathy patients was based on physician’s recommendation or registered patient
for dialysis. A detailed medical history of each patient was recorded. The unrelated controls were randomly
selected and recruited from local community centers. Participants were born into Bengali families in Kolkata
and the surrounding area.
Genotyping
Genomic DNA was prepared from fresh whole blood by using the conventional phenol-chloroform extraction
method followed by ethanol precipitation . In this study, previously published primers 5’GCTGTCTTCTG
[30]
GTGGTACTGCC3’(sense) and 5’TGCTGGCCATGAACTGGTTCTAGC3’ (antisense) were used for the PCR
based detections of single nucleotide polymorphisms (SNPs). PCR amplification was performed in a final volume
of 10 μL reaction mixture containing 50 ng of genomic DNA, 20 pmol of each primer, 10X Taq PCR buffer,
25 mM MgCl , 100 mM of each dNTPs and 0.5 U/uL of Red Taq polymerase. PCR amplification was performed
2
in a DNA thermo cycler (Bio-Rad). PCR was carried out with an initial denaturing time at 95 °C for 5 min.
Then the DNA was amplified for 35 cycles with denaturation at 94 °C for 1 min, annealing at 69 °C for 1:30 min
and extension at 72 °C for 1:30 min and final extension 72 °C for 10 min. The PCR products were checked by
1% agarose gel electrophoresis with ethidium bromide staining and directly visualized in UV light. Only
those PCR products that had a single amplification product with no evidence of non-specific amplification
were used for DNA sequencing. The samples were analyzed on ABI 3730 genetic analyzer with a 48 capillary
(Applied Biosystems, USA) to generate DNA sequences. Details described in our previous article [31,32] .
Statistical analysis
Allele frequencies were calculated for all the SNPs and were tested for Hardy-Weinberg equilibrium (HWE)
and allelic association with the disease (Chi-Square test/Fisher exact test). Allelic and genotype association
with the phenotypes was tested under different genetic models for both quantitative and qualitative traits
by regression analysis and Fisher model test. Allele frequencies were calculated for the SNPs and tested for
HWE and allelic association with disease (Fisher exact test, logistic regression and Fisher model tests) using
PLINK software . For comparing the allelic distributions between study groups, the odds ratio (OR) with
[33]
95% confidence interval (CI) were also calculated. A level of P < 0.05 was assumed statistically significant.
Linkage disequilibrium (LD) between all the SNPs and also for associated SNP’s was estimated using
Haploview 4.2 software . The pair wise LD statistics D’ and r2 was calculated for all markers and also for
[34]
associated SNP’s. The Haploview 4.2 with default program or settings (Gabriel et al. , 2002) was used to
[35]
assess the linkage disequilibrium (D’ and r2) between each pair of SNPs.
RESULTS
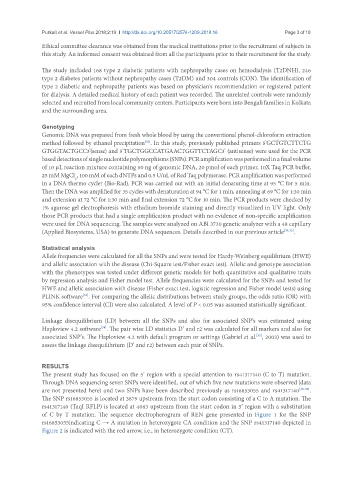
The present study has focused on the 5’ region with a special attention to rs41317140 (C to T) mutation.
Through DNA sequencing seven SNPs were identified, out of which five new mutations were observed (data
are not presented here) and two SNPs have been described previously as rs16853055 and rs41317140 [36-39] .
The SNP rs16853055 is located at 3879 upstream from the start codon consisting of a C to A mutation. The
rs41317140 (TaqI RFLP) is located at 4063 upstream from the start codon in 5’ region with a substitution
of C by T mutation. The sequence electropherogram of REN gene presented in Figure 1 for the SNP
rs16853055indicating C → A mutation in heterozygote CA condition and the SNP rs41317140 depicted in
Figure 2 is indicated with the red arrow, i.e., in heterozygote condition (CT).