
Page 158 - Read Online
P. 158
Page 4 of 10 Purkait et al. Vessel Plus 2018;2:19 I http://dx.doi.org/10.20517/2574-1209.2018.16
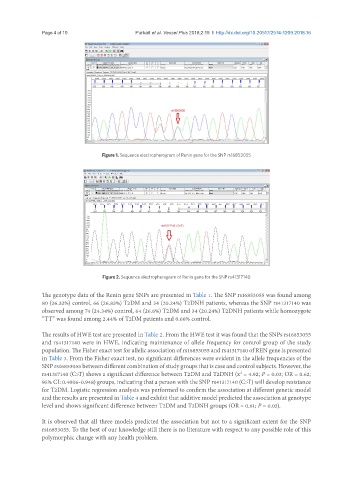
Figure 1. Sequence electropherogram of Renin gene for the SNP rs16853055
Figure 2. Sequence electropherogram of Renin gene for the SNP rs41317140
The genotype data of the Renin gene SNPs are presented in Table 1. The SNP rs16853055 was found among
80 (26.32%) control, 66 (26.83%) T2DM and 34 (20.24%) T2DNH patients, whereas the SNP rs41317140 was
observed among 74 (24.34%) control, 64 (26.6%) T2DM and 34 (20.24%) T2DNH patients while homozygote
“TT” was found among 2.44% of T2DM patients and 0.66% control.
The results of HWE test are presented in Table 2. From the HWE test it was found that the SNPs rs16853055
and rs41317140 were in HWE, indicating maintenance of allele frequency for control group of the study
population. The Fisher exact test for allelic association of rs16853055 and rs41317140 of REN gene is presented
in Table 3. From the Fisher exact test, no significant differences were evident in the allele frequencies of the
SNP rs16853055 between different combination of study groups that is case and control subjects. However, the
rs41317140 (C>T) shows a significant difference between T2DM and T2DNH (x = 4.92; P = 0.03; OR = 0.62;
2
95% CI: 0.4006-0.948) groups, indicating that a person with the SNP rs41317140 (C>T) will develop resistance
for T2DM. Logistic regression analysis was performed to confirm the association at different genetic model
and the results are presented in Table 4 and exhibit that additive model predicted the association at genotype
level and shows significant difference between T2DM and T2DNH groups (OR = 0.61; P = 0.03).
It is observed that all three models predicted the association but not to a significant extent for the SNP
rs16853055. To the best of our knowledge still there is no literature with respect to any possible role of this
polymorphic change with any health problem.