
Page 39 - Read Online
P. 39
Sobenin et al. Desialylated LDL in diabetes
RESULTS = 0.037). The same difference was observed for
sialylated and desialylated LDL from type 1 and type
Sialic acid content of LDL fractions 2 diabetic patients; however, in some cases, sialylated
Sialic acid content of total LDL preparations accounted LDL seemed slightly atherogenic, and desialylated
for 40.0 (SD 3.0) nmol/mg LDL protein in non-diabetic LDL caused extensive cholesterol accumulation, much
individuals, 32.9 (SD 2.8) nmol/mg in type 1, and 26.4 more than that of desialylated LDL from non-diabetic
(SD 3.9) nmol/mg in type 2 diabetic patients. Sialic acid individuals [Table 2]. The effect of total LDL from
content in diabetic patients’ LDL was significantly lower diabetic patients appeared to have intermediate value
than non-diabetic individuals (P = 0.027). Upon LDL between that of sialylated and desialylated LDL [Table 2],
sub-fractionation into non-bound and bound fractions
by affinity chromatography on RCA -agarose, non-
120
bound LDL in all studied groups were characterized by
high levels of sialic acid, quite comparable to normal
values [41.5 (SD 1.7), 38.7 (SD 1.4), and 35.1 (SD 1.8)
nmol/mg] LDL protein for non-diabetic individuals, type
1, and type 2 diabetic patients, respectively; (P > 0.1).
However, bound LDL had significantly lower sialic acid
levels than total LDL (P = 0.029) and non-bound LDL (P
= 0.009) in all studied groups; the levels accounted for
32.3 (SD 2.5), 24.8 (SD 4.0), and 17.9 (SD 2.3) nmol/mg L
LDL protein for non-diabetic individuals, type 1, and type
2 diabetic patients, respectively. Thus, the obtained LDL
fractions (non-bound and bound) differed significantly
in sialic acid content and might be readily regarded as
sialylated and desialylated LDL.
Density of sialylated and desialylated LDL
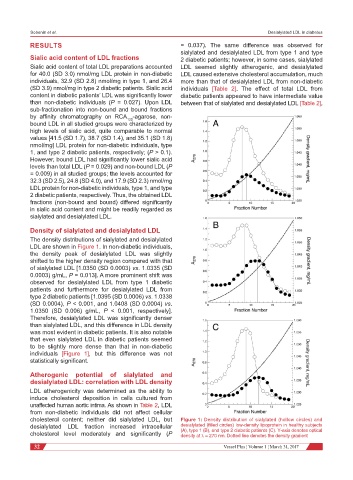
The density distributions of sialylated and desialylated
LDL are shown in Figure 1. In non-diabetic individuals,
the density peak of desialylated LDL was slightly
shifted to the higher density region compared with that
of sialylated LDL [1.0350 (SD 0.0003) vs. 1.0335 (SD
0.0003) g/mL, P = 0.013]. A more prominent shift was
observed for desialylated LDL from type 1 diabetic L
patients and furthermore for desialylated LDL from
type 2 diabetic patients [1.0395 (SD 0.0006) vs. 1.0338
(SD 0.0004), P < 0.001, and 1.0408 (SD 0.0004) vs.
1.0350 (SD 0.006) g/mL, P < 0.001, respectively].
Therefore, desialylated LDL was significantly denser
than sialylated LDL, and this difference in LDL density
was most evident in diabetic patients. It is also notable
that even sialylated LDL in diabetic patients seemed
to be slightly more dense than that in non-diabetic
individuals [Figure 1], but this difference was not
statistically significant.
Atherogenic potential of sialylated and
desialylated LDL: correlation with LDL density
LDL atherogenicity was determined as the ability to L
induce cholesterol deposition in cells cultured from
unaffected human aortic intima. As shown in Table 2, LDL
from non-diabetic individuals did not affect cellular
cholesterol content; neither did sialylated LDL, but Figure 1: Density distribution of sialylated (hollow circles) and
desialylated LDL fraction increased intracellular desialylated (filled circles) low-density lipoprotein in healthy subjects
cholesterol level moderately and significantly (P (A), type 1 (B), and type 2 diabetic patients (C). Y-axis denotes optical
density at λ = 270 nm. Dotted line denotes the density gradient
32 Vessel Plus ¦ Volume 1 ¦ March 31, 2017