
Page 177 - Read Online
P. 177
Harangi et al. HDL structure and function in dyslipidemia
A C
P < 0.05
MPO (ng/mL) PON1 paraoxonase activity (U/I)
Case Control Case Control
B D
P < 0.05
MPO/PON1 ratio PON1 arylesterase activity (U/I)
Case Control Case Control
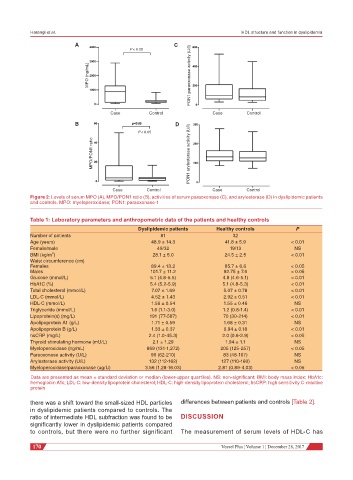
Figure 2: Levels of serum MPO (A), MPO/PON1 ratio (B), activities of serum paraoxonase (C), and arylesterase (D) in dyslipidemic patients
and controls. MPO: myeloperoxidase; PON1: paraoxonase-1
Table 1: Laboratory parameters and anthropometric data of the patients and healthy controls
Dyslipidemic patients Healthy controls P
Number of patients 81 32
Age (years) 48.9 ± 14.3 41.8 ± 5.9 < 0.01
Female/male 49/32 19/13 NS
2
BMI (kg/m ) 28.1 ± 5.0 24.5 ± 2.5 < 0.01
Waist circumference (cm)
Females 89.4 ± 13.2 85.7 ± 6.6 < 0.05
Males 101.7 ± 11.2 92.75 ± 7.6 < 0.05
Glucose (mmol/L) 5.1 (4.8-5.5) 4.8 (4.6-5.1) < 0.01
HbA1C (%) 5.4 (5.2-5.9) 5.1 (4.8-5.3) < 0.01
Total cholesterol (mmol/L) 7.07 ± 1.69 5.07 ± 0.78 < 0.01
LDL-C (mmol/L) 4.52 ± 1.43 2.92 ± 0.51 < 0.01
HDL-C (mmol/L) 1.56 ± 0.54 1.55 ± 0.46 NS
Triglyceride (mmol/L) 1.6 (1.1-3.0) 1.2 (0.8-1.4) < 0.01
Lipoprotein(a) (mg/L) 191 (77-587) 70 (30-214) < 0.01
Apolipoprotein A1 (g/L) 1.71 ± 0.59 1.68 ± 0.31 NS
Apolipoprotein B (g/L) 1.33 ± 0.37 0.94 ± 0.18 < 0.01
hsCRP (mg/L) 2.4 (1.0-45.3) 2.0 (0.6-2.9) < 0.05
Thyroid stimulating hormone (mU/L) 2.1 ± 1.29 1.94 ± 1.1 NS
Myeloperoxidase (ng/mL) 869 (131-1,272) 205 (125-257) < 0.05
Paraoxonase activity (U/L) 98 (62-210) 83 (48-167) NS
Arylesterase activity (U/L) 132 (112-162) 127 (110-160) NS
Myeloperoxidase/paraoxonase (ug/U) 3.56 (1.28-16.03) 2.81 (0.89-4.03) < 0.05
Data are presented as mean ± standard deviation or median (lower-upper quartiles). NS: non-significant; BMI: body mass index; HbA1c:
hemoglobin A1c; LDL-C: low-density lipoprotein cholesterol; HDL-C: high-density lipoprotein cholesterol; hsCRP: high sensitivity C-reactive
protein
there was a shift toward the small-sized HDL particles differences between patients and controls [Table 2].
in dyslipidemic patients compared to controls. The
ratio of intermediate HDL subfraction was found to be DISCUSSION
significantly lower in dyslipidemic patients compared
to controls, but there were no further significant The measurement of serum levels of HDL-C has
170 Vessel Plus ¦ Volume 1 ¦ December 28, 2017