
Page 176 - Read Online
P. 176
Harangi et al. HDL structure and function in dyslipidemia
2/ 6/2013 SAMPLE: 8-tube 8 hdl Quantimetrix LIPOPRINT SYSTEM
®
13: 57 VLDL HDL Subtractions Albumin
+
LDL 1 2 3 4 5 6 7 8 9 10
VLDL + LDL
HDL-1, -2, -3
HDL-4, -5, -6, -7
HDL-8, -9, -10
Albumin
Area % 14 13 8 11 12 22 6 5 5 5
Large Intermediate Small
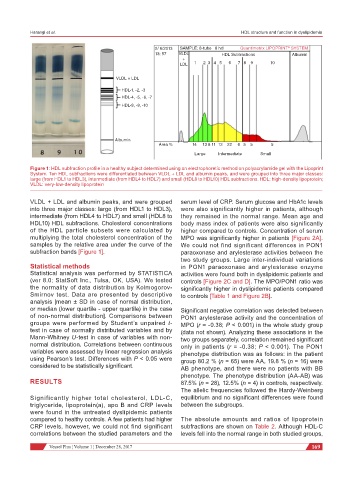
Figure 1: HDL subfraction profile in a healthy subject determined using an electrophoretic method on polyacrylamide gel with the Lipoprint
System. Ten HDL subfractions were differentiated between VLDL + LDL and albumin peaks, and were grouped into three major classes:
large (from HDL1 to HDL3), intermediate (from HDL4 to HDL7) and small (HDL8 to HDL10) HDL subfractions. HDL: high-density lipoprotein;
VLDL: very-low-density lipoprotein
VLDL + LDL and albumin peaks, and were grouped serum level of CRP. Serum glucose and HbA1c levels
into three major classes: large (from HDL1 to HDL3), were also significantly higher in patients, although
intermediate (from HDL4 to HDL7) and small (HDL8 to they remained in the normal range. Mean age and
HDL10) HDL subfractions. Cholesterol concentrations body mass index of patients were also significantly
of the HDL particle subsets were calculated by higher compared to controls. Concentration of serum
multiplying the total cholesterol concentration of the MPO was significantly higher in patients [Figure 2A].
samples by the relative area under the curve of the We could not find significant differences in PON1
subfraction bands [Figure 1]. paraoxonase and arylesterase activities between the
two study groups. Large inter-individual variations
Statistical methods in PON1 paraoxonase and arylesterase enzyme
Statistical analysis was performed by STATISTICA activities were found both in dyslipidemic patients and
(ver 8.0; StatSoft Inc., Tulsa, OK, USA). We tested controls [Figure 2C and D]. The MPO/PON1 ratio was
the normality of data distribution by Kolmogorov- significantly higher in dyslipidemic patients compared
Smirnov test. Data are presented by descriptive to controls [Table 1 and Figure 2B].
analysis [mean ± SD in case of normal distribution,
or median (lower quartile - upper quartile) in the case Significant negative correlation was detected between
of non-normal distribution]. Comparisons between PON1 arylesterase activity and the concentration of
groups were performed by Student’s unpaired t- MPO (r = -0.38; P < 0.001) in the whole study group
test in case of normally distributed variables and by (data not shown). Analyzing these associations in the
Mann-Whitney U-test in case of variables with non- two groups separately, correlation remained significant
normal distribution. Correlations between continuous only in patients (r = -0.38; P < 0.001). The PON1
variables were assessed by linear regression analysis phenotype distribution was as follows: in the patient
using Pearson’s test. Differences with P < 0.05 were group 80.2 % (n = 65) were AA, 19.8 % (n = 16) were
considered to be statistically significant. AB phenotype, and there were no patients with BB
phenotype. The phenotype distribution (AA-AB) was
RESULTS 87.5% (n = 28), 12.5% (n = 4) in controls, respectively.
The allelic frequencies followed the Hardy-Weinberg
Significantly higher total cholesterol, LDL-C, equilibrium and no significant differences were found
triglyceride, lipoprotein(a), apo B and CRP levels between the subgroups.
were found in the untreated dyslipidemic patients
compared to healthy controls. A few patients had higher The absolute amounts and ratios of lipoprotein
CRP levels, however, we could not find significant subfractions are shown on Table 2. Although HDL-C
correlations between the studied parameters and the levels fell into the normal range in both studied groups,
Vessel Plus ¦ Volume 1 ¦ December 28, 2017 169