


Page 11 - Read Online
P. 11
Page 6 of 14                                                      Lust et al. Vessel Plus 2021;5:7  I  http://dx.doi.org/10.20517/2574-1209.2020.52


                           HUVEC


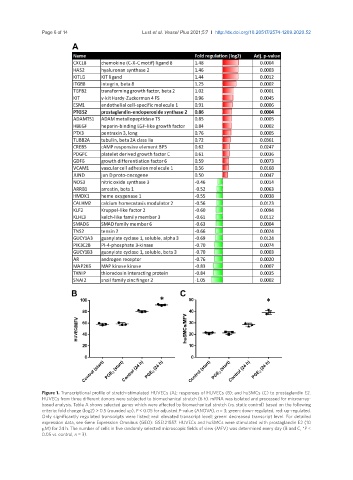
               Figure 1. Transcriptional profile of stretch-stimulated HUVECs (A); responses of HUVECs (B); and huSMCs (C) to prostaglandin E2.
               HUVECs from three different donors were subjected to biomechanical stretch (6 h). mRNA was isolated and processed for microarray-
               based analysis. Table A shows selected genes which were affected by biomechanical stretch (vs. static control) based on the following
               criteria: fold change (log2) > 0.5 (rounded up), P < 0.05 for adjusted P-value (ANOVA), n = 3; green: down-regulated, red: up-regulated.
               Only significantly regulated transcripts were listed; red: elevated transcript level; green: decreased transcript level. For detailed
               expression data, see Gene Expression Omnibus (GEO): GSE121557. HUVECs and huSMCs were stimulated with prostaglandin E2 (10
               μM) for 24 h. The number of cells in five randomly selected microscopic fields of view (MFV) was determined every day (B and C, *P <
               0.05 vs. control, n = 3).

