


Page 125 - Read Online
P. 125
Cheng et al. Soft Sci. 2026, 6, 36                                                Page 7 of 15


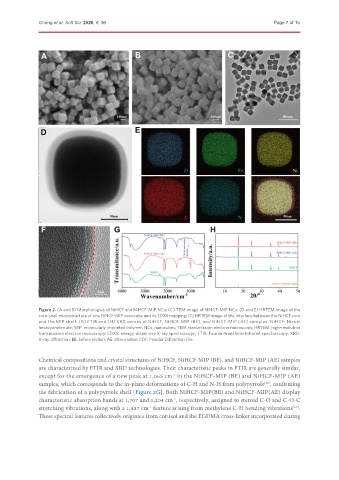
               Figure 2. (A and B) Morphologies of NiHCF and NiHCF-MIP NCs; (C) TEM image of NiHCF-MIP NCs; (D and E) HRTEM image of the
               core-shell microstructure of one NiHCF-MIP nanocube and its EDXS mapping; (F) HRTEM image of the interface between the NiHCF core
               and the MIP shell; (G) FTIR and (H) XRD curves of NiHCF, NiHCF-MIP (BE), and NiHCF-MIP (AE) samples. NiHCF: Nickel
               hexacyanoferrate; MIP: molecularly imprinted polymer; NCs: nanocubes; TEM: transmission electron microscopy; HRTEM: high-resolution
               transmission electron microscopy; EDXS: energy-dispersive X-ray spectroscopy; FTIR: Fourier-transform infrared spectroscopy; XRD:
               X-ray diffraction; BE: before elution; AE: after elution; PDF: Powder Diffraction File.


               Chemical compositions and crystal structures of NiHCF, NiHCF-MIP (BE), and NiHCF-MIP (AE) samples
               are characterized by FTIR and XRD technologies. Their characteristic peaks in FTIR are generally similar,
               except for the emergence of a new peak at 1,065 cm  in the NiHCF-MIP (BE) and NiHCF-MIP (AE)
                                                              -1
               samples, which corresponds to the in-plane deformations of C-H and N-H from polypyrrole , confirming
                                                                                              [28]
               the fabrication of a polypyrrole shell [Figure 2G]. Both NiHCF-MIP(BE) and NiHCF-MIP(AE) display
               characteristic absorption bands at 1,707 and 1,204 cm , respectively, assigned to steroid C-O and C-O-C
                                                              -1
               stretching vibrations, along with a 1,437 cm  feature arising from methylene C-H bending vibrations .
                                                                                                        [29]
                                                     -1
               These spectral features collectively originate from cortisol and the EGDMA cross-linker incorporated during

