
Page 82 - Read Online
P. 82
Page 6 of 13 Zhao et al. Soft Sci. 2025, 5, 10 https://dx.doi.org/10.20517/ss.2024.61
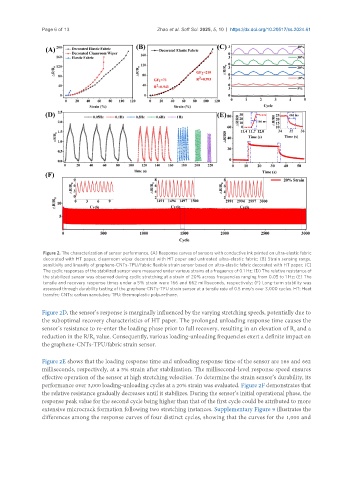
Figure 2. The characterization of sensor performance. (A) Response curves of sensors with conductive ink printed on ultra-elastic fabric
decorated with HT paper, cleanroom wiper decorated with HT paper and untreated ultra-elastic fabric; (B) Strain sensing range,
sensitivity and linearity of graphene-CNTs-TPU/fabric flexible strain sensor based on ultra-elastic fabric decorated with HT paper; (C)
The cyclic responses of the stabilized sensor were measured under various strains at a frequency of 0.1 Hz; (D) The relative resistance of
the stabilized sensor was observed during cyclic stretching at a strain of 20% across frequencies ranging from 0.05 to 1 Hz; (E) The
tensile and recovery response times under a 5% strain were 166 and 662 milliseconds, respectively; (F) Long-term stability was
assessed through durability testing of the graphene-CNTs-TPU strain sensor at a tensile rate of 0.5 mm/s over 3,000 cycles. HT: Heat
transfer; CNTs: carbon nanotubes; TPU: thermoplastic polyurethane.
Figure 2D, the sensor’s response is marginally influenced by the varying stretching speeds, potentially due to
the suboptimal recovery characteristics of HT paper. The prolonged unloading response time causes the
sensor’s resistance to re-enter the loading phase prior to full recovery, resulting in an elevation of R and a
0
reduction in the R/R value. Consequently, various loading-unloading frequencies exert a definite impact on
0
the graphene-CNTs-TPU/fabric strain sensor.
Figure 2E shows that the loading response time and unloading response time of the sensor are 166 and 662
milliseconds, respectively, at a 5% strain after stabilization. The millisecond-level response speed ensures
effective operation of the sensor at high stretching velocities. To determine the strain sensor’s durability, its
performance over 3,000 loading-unloading cycles at a 20% strain was evaluated. Figure 2F demonstrates that
the relative resistance gradually decreases until it stabilizes. During the sensor’s initial operational phase, the
response peak value for the second cycle being higher than that of the first cycle could be attributed to more
extensive microcrack formation following two stretching instances. Supplementary Figure 9 illustrates the
differences among the response curves of four distinct cycles, showing that the curves for the 1,000 and