
Page 81 - Read Online
P. 81
Zhao et al. Soft Sci. 2025, 5, 10 https://dx.doi.org/10.20517/ss.2024.61 Page 5 of 13
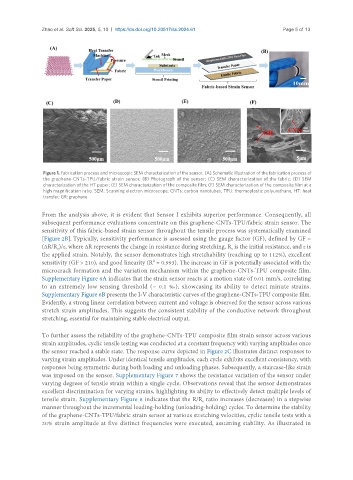
Figure 1. Fabrication process and microscopic SEM characterization of the sensor. (A) Schematic illustration of the fabrication process of
the graphene-CNTs-TPU/fabric strain sensor; (B) Photograph of the sensor; (C) SEM characterization of the fabric; (D) SEM
characterization of the HT paper; (E) SEM characterization of the composite film; (F) SEM characterization of the composite film at a
high magnification ratio. SEM: Scanning electron microscope; CNTs: carbon nanotubes; TPU: thermoplastic polyurethane; HT: heat
transfer; GR: graphene.
From the analysis above, it is evident that Sensor I exhibits superior performance. Consequently, all
subsequent performance evaluations concentrate on this graphene-CNTs-TPU/fabric strain sensor. The
sensitivity of this fabric-based strain sensor throughout the tensile process was systematically examined
[Figure 2B]. Typically, sensitivity performance is assessed using the gauge factor (GF), defined by GF =
(ΔR/R )/ε, where ΔR represents the change in resistance during stretching, R is the initial resistance, and ε is
0
0
the applied strain. Notably, the sensor demonstrates high stretchability (reaching up to 112%), excellent
sensitivity (GF > 210), and good linearity (R² = 0.993). The increase in GF is potentially associated with the
microcrack formation and the variation mechanism within the graphene-CNTs-TPU composite film.
Supplementary Figure 6A indicates that the strain sensor reacts at a motion state of 0.01 mm/s, correlating
to an extremely low sensing threshold (~ 0.1 ‰), showcasing its ability to detect minute strains.
Supplementary Figure 6B presents the I-V characteristic curves of the graphene-CNTs-TPU composite film.
Evidently, a strong linear correlation between current and voltage is observed for the sensor across various
stretch strain amplitudes. This suggests the consistent stability of the conductive network throughout
stretching, essential for maintaining stable electrical output.
To further assess the reliability of the graphene-CNTs-TPU composite film strain sensor across various
strain amplitudes, cyclic tensile testing was conducted at a constant frequency with varying amplitudes once
the sensor reached a stable state. The response curve depicted in Figure 2C illustrates distinct responses to
varying strain amplitudes. Under identical tensile amplitudes, each cycle exhibits excellent consistency, with
responses being symmetric during both loading and unloading phases. Subsequently, a staircase-like strain
was imposed on the sensor. Supplementary Figure 7 shows the resistance variation of the sensor under
varying degrees of tensile strain within a single cycle. Observations reveal that the sensor demonstrates
excellent discrimination for varying strains, highlighting its ability to effectively detect multiple levels of
tensile strain. Supplementary Figure 8 indicates that the R/R ratio increases (decreases) in a stepwise
0
manner throughout the incremental loading-holding (unloading-holding) cycles. To determine the stability
of the graphene-CNTs-TPU/fabric strain sensor at various stretching velocities, cyclic tensile tests with a
20% strain amplitude at five distinct frequencies were executed, assuming stability. As illustrated in