
Page 66 - Read Online
P. 66
Zhong et al. Soft Sci. 2025, 5, 3 https://dx.doi.org/10.20517/ss.2024.52 Page 5 of 15
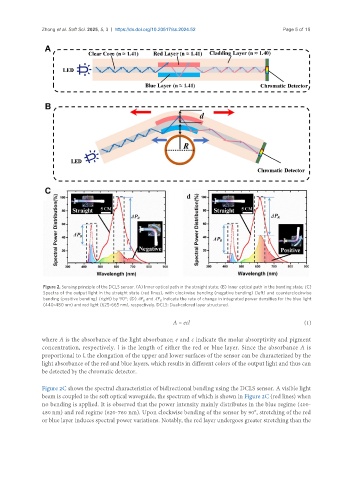
Figure 2. Sensing principle of the DCLS sensor. (A) Inner optical path in the straight state; (B) Inner optical path in the bending state; (C)
Spectra of the output light in the straight state (red lines), with clockwise bending (negative bending) (left) and counterclockwise
bending (positive bending) (right) by 90°; (D) ΔP and ΔP indicate the rate of change in integrated power densities for the blue light
B R
(440-480 nm) and red light (625-665 nm), respectively. DCLS: Dual-colored layer structured.
A = ecl (1)
where A is the absorbance of the light absorbance; e and c indicate the molar absorptivity and pigment
concentration, respectively. l is the length of either the red or blue layer. Since the absorbance A is
proportional to l, the elongation of the upper and lower surfaces of the sensor can be characterized by the
light absorbance of the red and blue layers, which results in different colors of the output light and thus can
be detected by the chromatic detector.
Figure 2C shows the spectral characteristics of bidirectional bending using the DCLS sensor. A visible light
beam is coupled to the soft optical waveguide, the spectrum of which is shown in Figure 2C (red lines) when
no bending is applied. It is observed that the power intensity mainly distributes in the blue regime (400-
480 nm) and red regime (620-760 nm). Upon clockwise bending of the sensor by 90°, stretching of the red
or blue layer induces spectral power variations. Notably, the red layer undergoes greater stretching than the