
Page 22 - Read Online
P. 22
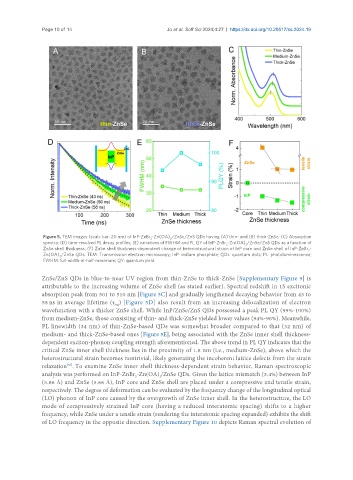
Page 10 of 14                             Jo et al. Soft Sci 2024;4:27  https://dx.doi.org/10.20517/ss.2024.19


                Figure 5. TEM images (scale bar: 20 nm) of InP-ZnBr -Zn(OA) /ZnSe/ZnS QDs having (A) thin- and (B) thick-ZnSe; (C) Absorption
                                                    2
                                                          2
                spectra; (D) time-resolved PL decay profiles; (E) variations of FWHM and PL QY of InP-ZnBr -Zn(OA) /ZnSe/ZnS QDs as a function of
                                                                             2
                                                                                    2
                ZnSe shell thickness; (F) ZnSe shell thickness-dependent change of heterostructural strain of InP core and ZnSe shell of InP-ZnBr -
                                                                                                         2
                Zn(OA) /ZnSe QDs. TEM: Transmission electron microscopy; InP: indium phosphide; QDs: quantum dots; PL: photoluminescence;
                     2
                FWHM: full-width-at-half-maximum; QY: quantum yield.
               ZnSe/ZnS QDs in blue-to-near UV region from thin-ZnSe to thick-ZnSe [Supplementary Figure 9] is
               attributable to the increasing volume of ZnSe shell (as stated earlier). Spectral redshift in 1S excitonic
               absorption peak from 501 to 510 nm [Figure 5C] and gradually lengthened decaying behavior from 43 to
               58 ns in average lifetime (τ ) [Figure 5D] also result from an increasing delocalization of electron
                                        avg
               wavefunction with a thicker ZnSe shell. While InP/ZnSe/ZnS QDs possessed a peak PL QY (99%-100%)
               from medium-ZnSe, those consisting of thin- and thick-ZnSe yielded lower values (94%-96%). Meanwhile,
               PL linewidth (34 nm) of thin-ZnSe-based QDs was somewhat broader compared to that (32 nm) of
               medium- and thick-ZnSe-based ones [Figure 5E], being associated with the ZnSe inner shell thickness-
               dependent exciton-phonon coupling strength aforementioned. The above trend in PL QY indicates that the
               critical ZnSe inner shell thickness lies in the proximity of 1.8 nm (i.e., medium-ZnSe), above which the
               heterostructural strain becomes nontrivial, likely generating the incoherent lattice defects from the strain
                        [56]
               relaxation . To examine ZnSe inner shell thickness-dependent strain behavior, Raman spectroscopic
               analysis was performed on InP-ZnBr -Zn(OA) /ZnSe QDs. Given the lattice mismatch (3.4%) between InP
                                               2
                                                       2
               (5.86 Å) and ZnSe (5.66 Å), InP core and ZnSe shell are placed under a compressive and tensile strain,
               respectively. The degree of deformation can be evaluated by the frequency change of the longitudinal optical
               (LO) phonon of InP core caused by the overgrowth of ZnSe inner shell. In the heterostructure, the LO
               mode of compressively strained InP core (having a reduced interatomic spacing) shifts to a higher
               frequency, while ZnSe under a tensile strain (rendering the interatomic spacing expanded) exhibits the shift
               of LO frequency in the opposite direction. Supplementary Figure 10 depicts Raman spectral evolution of