
Page 7 - Read Online
P. 7
Kim et al. Soft Sci 2024;4:12 https://dx.doi.org/10.20517/ss.2023.50 Page 5 of 11
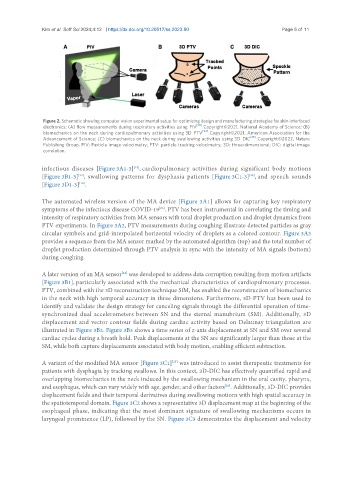
Figure 2. Schematic showing computer vision experimental setup for optimizing design and manufacturing strategies for skin-interfaced
electronics: (A) flow measurements during respiratory activities using PIV [10] . Copyright©2021, National Academy of Science; (B)
biomechanics on the neck during cardiopulmonary activities using 3D PTV [24] . Copyright©2021, American Association for the
Advancement of Science; (C) biomechanics on the neck during swallowing activities using 3D DIC [25] . Copyright©2022, Nature
Publishing Group. PIV: Particle image velocimetry; PTV: particle tracking velocimetry; 3D: three-dimensional; DIC: digital image
correlation.
infectious diseases [Figure 3A1-3] , cardiopulmonary activities during significant body motions
[23]
[24]
[25]
[Figure 3B1-3] , swallowing patterns for dysphasia patients [Figure 3C1-3] , and speech sounds
[10]
[Figure 3D1-3] .
The automated wireless version of the MA device [Figure 3A1] allows for capturing key respiratory
symptoms of the infectious disease COVID-19 . PTV has been instrumental in correlating the timing and
[23]
intensity of respiratory activities from MA sensors with total droplet production and droplet dynamics from
PTV experiments. In Figure 3A2, PTV measurements during coughing illustrate detected particles as gray
circular symbols and grid-interpolated horizontal velocity of droplets as a colored contour. Figure 3A3
provides a sequence from the MA sensor marked by the automated algorithm (top) and the total number of
droplet production determined through PTV analysis in sync with the intensity of MA signals (bottom)
during coughing.
[24]
A later version of an MA sensor was developed to address data corruption resulting from motion artifacts
[Figure 3B1], particularly associated with the mechanical characteristics of cardiopulmonary processes.
PTV, combined with the 3D reconstruction technique SfM, has enabled the reconstruction of biomechanics
in the neck with high temporal accuracy in three dimensions. Furthermore, 3D-PTV has been used to
identify and validate the design strategy for canceling signals through the differential operation of time-
synchronized dual accelerometers between SN and the sternal manubrium (SM). Additionally, 3D
displacement and vector contour fields during cardiac activity based on Delaunay triangulation are
illustrated in Figure 3B2. Figure 3B3 shows a time series of z-axis displacement at SN and SM over several
cardiac cycles during a breath hold. Peak displacements at the SN are significantly larger than those at the
SM, while both capture displacements associated with body motion, enabling efficient subtraction.
A variant of the modified MA sensor [Figure 3C1] was introduced to assist therapeutic treatments for
[25]
patients with dysphagia by tracking swallows. In this context, 3D-DIC has effectively quantified rapid and
overlapping biomechanics in the neck induced by the swallowing mechanism in the oral cavity, pharynx,
[26]
and esophagus, which can vary widely with age, gender, and other factors . Additionally, 3D-DIC provides
displacement fields and their temporal derivatives during swallowing motions with high spatial accuracy in
the spatiotemporal domain. Figure 3C2 shows a representative 3D displacement map at the beginning of the
esophageal phase, indicating that the most dominant signature of swallowing mechanisms occurs in
laryngeal prominence (LP), followed by the SN. Figure 3C3 demonstrates the displacement and velocity