
Page 43 - Read Online
P. 43
Wei et al. Soft Sci 2023;3:17 https://dx.doi.org/10.20517/ss.2023.09 Page 15 of 38
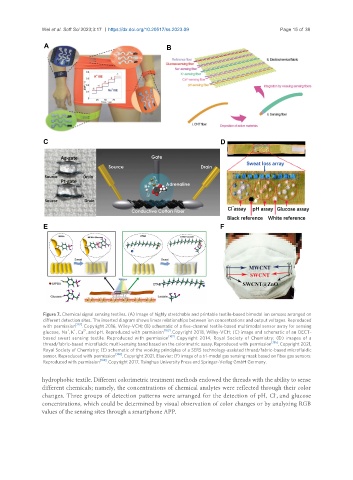
Figure 7. Chemical signal sensing textiles. (A) Image of highly stretchable and printable textile-based bimodal ion sensors arranged on
different detection sites. The inserted diagram shows linear relationships between ion concentrations and output voltages. Reproduced
with permission [162] . Copyright 2016, Wiley-VCH; (B) schematic of a five-channel textile-based multimodal sensor array for sensing
+
2+
+
glucose, Na , K , Ca , and pH. Reproduced with permission [163] . Copyright 2018, Wiley-VCH; (C) image and schematic of an OECT-
based sweat sensing textile. Reproduced with permission [167] . Copyright 2014, Royal Society of Chemistry; (D) images of a
thread/fabric-based microfluidic multi-sensing band based on the colorimetric assay. Reproduced with permission [165] . Copyright 2021,
Royal Society of Chemistry; (E) schematic of the working principles of a SERS technology-assisted thread/fabric-based microfluidic
sensor. Reproduced with permission [166] . Copyright 2021, Elsevier; (F) image of a tri-modal gas sensing mask based on fiber gas sensors.
Reproduced with permission [168] . Copyright 2017, Tsinghua University Press and Springer-Verlag GmbH Germany.
hydrophobic textile. Different colorimetric treatment methods endowed the threads with the ability to sense
different chemicals; namely, the concentrations of chemical analytes were reflected through their color
changes. Three groups of detection patterns were arranged for the detection of pH, Cl , and glucose
-
concentrations, which could be determined by visual observation of color changes or by analyzing RGB
values of the sensing sites through a smartphone APP.