
Page 104 - Read Online
P. 104
Hussain et al. Soft Sci. 2025, 5, 21 https://dx.doi.org/10.20517/ss.2025.02 Page 7 of 19
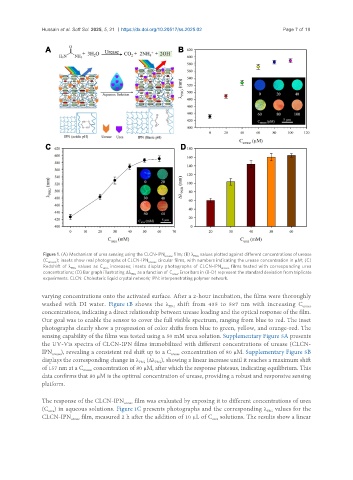
Figure 1. (A) Mechanism of urea sensing using the CLCN-IPN urease film; (B) λ PBG values plotted against different concentrations of urease
(C urease ); insets show real photographs of CLCN-IPN urease circular films, with numbers indicating the urease concentration in µM; (C)
Redshift of λ PBG values as C urea increases; insets display photographs of CLCN-IPN urease films tested with corresponding urea
concentrations; (D) Bar graph illustrating Δλ PBG as a function of C urea . Error bars in (B-D) represent the standard deviation from triplicate
experiments. CLCN: Cholesteric liquid crystal network; IPN: interpenetrating polymer network.
varying concentrations onto the activated surface. After a 2-hour incubation, the films were thoroughly
washed with DI water. Figure 1B shows the λ shift from 435 to 587 nm with increasing C urease
PBG
concentrations, indicating a direct relationship between urease loading and the optical response of the film.
Our goal was to enable the sensor to cover the full visible spectrum, ranging from blue to red. The inset
photographs clearly show a progression of color shifts from blue to green, yellow, and orange-red. The
sensing capability of the films was tested using a 50 mM urea solution. Supplementary Figure 5A presents
the UV-Vis spectra of CLCN-IPN films immobilized with different concentrations of urease (CLCN-
IPN urease ), revealing a consistent red shift up to a C urease concentration of 80 µM. Supplementary Figure 5B
displays the corresponding change in λ (Δλ ), showing a linear increase until it reaches a maximum shift
PBG
PBG
of 157 nm at a C urease concentration of 80 µM, after which the response plateaus, indicating equilibrium. This
data confirms that 80 µM is the optimal concentration of urease, providing a robust and responsive sensing
platform.
The response of the CLCN-IPN urease film was evaluated by exposing it to different concentrations of urea
(C ) in aqueous solutions. Figure 1C presents photographs and the corresponding λ values for the
PBG
urea
CLCN-IPN urease film, measured 2 h after the addition of 10 µL of C solutions. The results show a linear
urea