
Page 102 - Read Online
P. 102
Hussain et al. Soft Sci. 2025, 5, 21 https://dx.doi.org/10.20517/ss.2025.02 Page 5 of 19
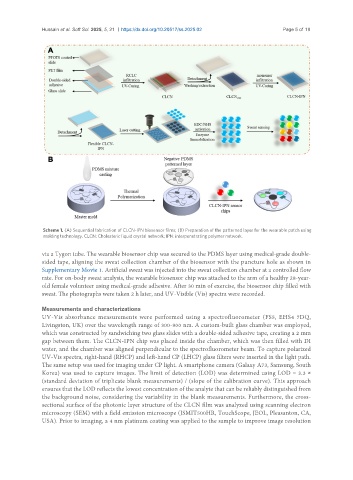
Scheme 1. (A) Sequential fabrication of CLCN-IPN biosensor films; (B) Preparation of the patterned layer for the wearable patch using
molding technology. CLCN: Cholesteric liquid crystal network; IPN: interpenetrating polymer network.
via a Tygon tube. The wearable biosensor chip was secured to the PDMS layer using medical-grade double-
sided tape, aligning the sweat collection chamber of the biosensor with the puncture hole as shown in
Supplementary Movie 1. Artificial sweat was injected into the sweat collection chamber at a controlled flow
rate. For on-body sweat analysis, the wearable biosensor chip was attached to the arm of a healthy 28-year-
old female volunteer using medical-grade adhesive. After 30 min of exercise, the biosensor chip filled with
sweat. The photographs were taken 2 h later, and UV-Visible (Vis) spectra were recorded.
Measurements and characterizations
UV-Vis absorbance measurements were performed using a spectrofluorometer (FS5, EHS4 7DQ,
Livingston, UK) over the wavelength range of 300-900 nm. A custom-built glass chamber was employed,
which was constructed by sandwiching two glass slides with a double-sided adhesive tape, creating a 2 mm
gap between them. The CLCN-IPN chip was placed inside the chamber, which was then filled with DI
water, and the chamber was aligned perpendicular to the spectrofluorometer beam. To capture polarized
UV-Vis spectra, right-hand (RHCP) and left-hand CP (LHCP) glass filters were inserted in the light path.
The same setup was used for imaging under CP light. A smartphone camera (Galaxy A73, Samsung, South
Korea) was used to capture images. The limit of detection (LOD) was determined using LOD = 3.3 ×
(standard deviation of triplicate blank measurements) / (slope of the calibration curve). This approach
ensures that the LOD reflects the lowest concentration of the analyte that can be reliably distinguished from
the background noise, considering the variability in the blank measurements. Furthermore, the cross-
sectional surface of the photonic layer structure of the CLCN film was analyzed using scanning electron
microscopy (SEM) with a field emission microscope (JSMIT500HR, TouchScope, JEOL, Pleasanton, CA,
USA). Prior to imaging, a 4 nm platinum coating was applied to the sample to improve image resolution