
Page 142 - Read Online
P. 142
Lin et al. Plast Aesthet Res 2019;6:16 I http://dx.doi.org/10.20517/2347-9264.2019.23 Page 5 of 10
A B
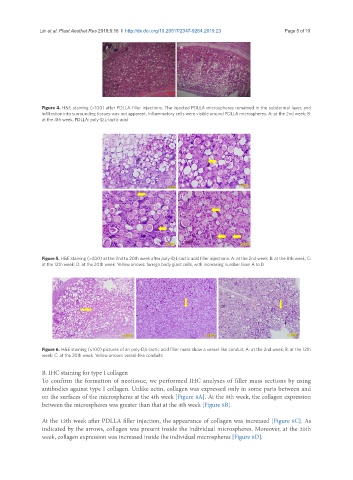
Figure 4. H&E staining (×100) after PDLLA filler injections. The injected PDLLA microspheres remained in the subdermal layer, and
infiltration into surrounding tissues was not apparent. Inflammatory cells were visible around PDLLA microspheres. A: at the 2nd week; B:
at the 4th week. PDLLA: poly-D,L-lactic acid
A B
C D
Figure 5. H&E staining (×400) at the 2nd to 20th week after poly-D,L-lactic acid filler injections. A: at the 2nd week; B: at the 8th week; C:
at the 12th week; D: at the 20th week. Yellow arrows: foreign body giant cells, with increasing number from A to D
A B C
Figure 6. H&E staining (×100) pictures of an poly-D,L-lactic acid filler mass show a vessel-like conduit. A: at the 2nd week; B: at the 12th
week; C: at the 20th week. Yellow arrows: vessel-like conduits
B. IHC staining for type I collagen
To confirm the formation of neotissue, we performed IHC analyses of filler mass sections by using
antibodies against type I collagen. Unlike actin, collagen was expressed only in some parts between and
on the surfaces of the microspheres at the 4th week [Figure 8A]. At the 8th week, the collagen expression
between the microspheres was greater than that at the 4th week [Figure 8B].
At the 12th week after PDLLA filler injection, the appearance of collagen was increased [Figure 8C]. As
indicated by the arrows, collagen was present inside the individual microspheres. Moreover, at the 20th
week, collagen expression was increased inside the individual microspheres [Figure 8D].