
Page 372 - Read Online
P. 372
Barel et al. Ultrasound body contouring
Table 2: Circumference changes from baseline by day and study group in treatment area
2
2
Change from High power (Isppa 440 W/cm ) Low power (Isppa 370 W/cm ) Weight differences
between groups
baseline
Number Mean (cm) SE P value Number Mean (cm) SE P value P value
Day 14 19 -1.54 0.57 0.016 17 -0.39 0.24 0.113 0.8741
Day 28 19 -1.65 0.42 < 0.001 17 -0.87 0.33 0.019 0.9317
Day 56 19 -2.14 0.60 0.002 17 -1.62 0.36 < 0.001 0.9981
Day 84 19 -2.56 0.63 < 0.001 17 -1.49 0.52 0.012 0.9896
Table 3: Circumference changes from baseline by day and study group in control area (untreated thighs)
2
2
High power (Isppa 440 W/cm ) Low power (Isppa 370 W/cm )
Change from baseline
Number Mean (cm) SE P value Number Mean (cm) SE P value
Day 14 19 0.32 0.31 0.316 17 -0.02 0.24 0.933
Day 28 19 0.47 0.37 0.214 17 0.17 0.24 0.484
Day 56 19 0.60 0.26 0.033 17 0.60 0.42 0.176
Day 84 19 1.08 0.32 0.003 17 1.25 0.48 0.019
Table 4: Results of subject satisfaction feedback questionnaire
Day 28 Day 56 Day 84
Questions in questionnaire
High power Low power High power Low power High power Low power
Subjects reported favorable change in body 27.8% 41.2% 61.1% 64.7% 68.4% 58.8%
contour since beginning of study
Subjects reported receiving comments from 27.8% 41.2% 72.2% 70.6% 57.9% 70.6%
other people regarding their appearance
Subjects reported to recommend this 77.8% 76.5% 72.2% 76.5% 68.4% 70.6%
procedure to their friends
Subjects reported to prefer the Contour I™
treatments over a short-term body contouring 66.7% 70.6% 66.7% 64.7% 89.5% 70.6%
procedure Electric power 160 W treatment, 84.2% after the second treatment, and
84.2% after the third; corresponding values in the
(6,720 mg)
1.2
1.0
Internal control circumference changes (cm) 1.4 Electric power 270 W low-power group were 94.1%, 82.3%, and 88.2%.
“Unbearable” pain sensation was uncommon across all
0.8
(8,000 mg)
treatments and modalities. “Unbearable” pain sensation
0.6
at all 3 sessions was reported by one subject in the
0.4
low-power group, at the first session by 2 subjects in
0.2
0.0
sessions by one subject in the high-power group. All
-0.2 Baseline 14 28 56 84 the high-power group, and at the second and third
Day reports were obtained after the treatments were done,
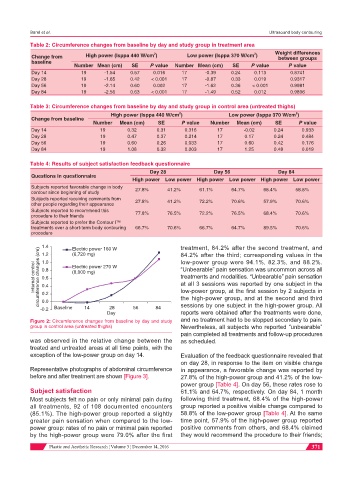
Figure 2: Circumference changes from baseline by day and study and no treatment had to be stopped secondary to pain.
group in control area (untreated thighs) Nevertheless, all subjects who reported “unbearable”
pain completed all treatments and follow-up procedures
was observed in the relative change between the as scheduled.
treated and untreated areas at all time points, with the
exception of the low-power group on day 14. Evaluation of the feedback questionnaire revealed that
on day 28, in response to the item on visible change
Representative photographs of abdominal circumference in appearance, a favorable change was reported by
before and after treatment are shown [Figure 3]. 27.8% of the high-power group and 41.2% of the low-
power group [Table 4]. On day 56, these rates rose to
Subject satisfaction 61.1% and 64.7%, respectively. On day 84, 1 month
Most subjects felt no pain or only minimal pain during following third treatment, 68.4% of the high-power
all treatments, 92 of 108 documented encounters group reported a positive visible change compared to
(85.1%). The high-power group reported a slightly 58.8% of the low-power group [Table 4]. At the same
greater pain sensation when compared to the low- time point, 57.9% of the high-power group reported
power group: rates of no pain or minimal pain reported positive comments from others, and 68.4% claimed
by the high-power group were 79.0% after the first they would recommend the procedure to their friends;
Plastic and Aesthetic Research ¦ Volume 3 ¦ December 14, 2016 371