
Page 371 - Read Online
P. 371
Barel et al. Ultrasound body contouring
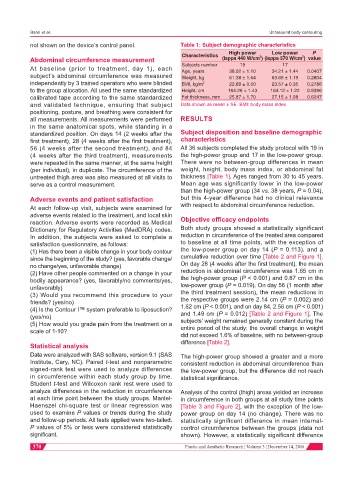
not shown on the device’s control panel. Table 1: Subject demographic characteristics
Characteristics High power 2 Low power 2 P
Abdominal circumference measurement (Isppa 440 W/cm ) (Isppa 370 W/cm ) value
19
17
At baseline (prior to treatment, day 1), each Subjects number 38.02 ± 1.10 34.21 ± 1.44 0.0407
Age, years
subject’s abdominal circumference was measured Weight, kg 61.38 ± 1.64 63.65 ± 1.19 0.2804
independently by 3 trained operators who were blinded BMI, kg/m 2 22.89 ± 0.50 23.57 ± 0.35 0.2786
to the group allocation. All used the same standardized Height, cm 164.26 ± 1.43 164.12 ± 1.22 0.9396
calibrated tape according to the same standardized Fat thickness, mm 25.87 ± 1.70 27.15 ± 1.98 0.6247
and validated technique, ensuring that subject Data shown as mean ± SE. BMI: body mass index
positioning, posture, and breathing were consistent for
all measurements. All measurements were performed RESULTS
in the same anatomical spots, while standing in a
standardized position. On days 14 (2 weeks after the Subject disposition and baseline demographic
first treatment), 28 (4 weeks after the first treatment), characteristics
56 (4 weeks after the second treatment), and 84 All 36 subjects completed the study protocol with 19 in
(4 weeks after the third treatment), measurements the high-power group and 17 in the low-power group.
were repeated in the same manner, at the same height There were no between-group differences in mean
(per individual), in duplicate. The circumference of the weight, height, body mass index, or abdominal fat
untreated thigh area was also measured at all visits to thickness [Table 1]. Ages ranged from 30 to 45 years.
serve as a control measurement. Mean age was significantly lower in the low-power
than the high-power group (34 vs. 38 years, P = 0.04),
Adverse events and patient satisfaction but this 4-year difference had no clinical relevance
At each follow-up visit, subjects were examined for with respect to abdominal circumference reduction.
adverse events related to the treatment, and local skin
reaction. Adverse events were recorded as Medical Objective efficacy endpoints
Dictionary for Regulatory Activities (MedDRA) codes. Both study groups showed a statistically significant
In addition, the subjects were asked to complete a reduction in circumference of the treated area compared
satisfaction questionnaire, as follows: to baseline at all time points, with the exception of
(1) Has there been a visible change in your body contour the low-power group on day 14 (P = 0.113), and a
since the beginning of the study? (yes, favorable change/ cumulative reduction over time [Table 2 and Figure 1].
no change/yes, unfavorable change) On day 28 (4 weeks after the first treatment), the mean
(2) Have other people commented on a change in your reduction in abdominal circumference was 1.65 cm in
bodily appearance? (yes, favorably/no comments/yes, the high-power group (P < 0.001) and 0.87 cm in the
unfavorably) low-power group (P = 0.019). On day 56 (1 month after
(3) Would you recommend this procedure to your the third treatment session), the mean reductions in
friends? (yes/no) the respective groups were 2.14 cm (P = 0.002) and
(4) Is the Contour I™ system preferable to liposuction? 1.62 cm (P < 0.001), and on day 84, 2.56 cm (P < 0.001)
(yes/no) and 1.49 cm (P = 0.012) [Table 2 and Figure 1]. The
subjects’ weight remained generally constant during the
(5) How would you grade pain from the treatment on a entire period of the study; the overall change in weight
scale of 1-10?
did not exceed 1.6% of baseline, with no between-group
difference [Table 2].
Statistical analysis
Data were analyzed with SAS software, version 9.1 (SAS The high-power group showed a greater and a more
Institute, Cary, NC). Paired t-test and nonparametric consistent reduction in abdominal circumference than
signed-rank test were used to analyze differences the low-power group, but the difference did not reach
in circumference within each study group by time. statistical significance.
Student t-test and Wilcoxon rank rest were used to
analyze differences in the reduction in circumference Analysis of the control (thigh) areas yielded an increase
at each time point between the study groups. Mantel- in circumference in both groups at all study time points
Haenszel chi-square test or linear regression was [Table 3 and Figure 2], with the exception of the low-
used to examine P values or trends during the study power group on day 14 (no change). There was no
and follow-up periods. All tests applied were two-tailed. statistically significant difference in mean internal-
P values of 5% or less were considered statistically control circumference between the groups (data not
significant. shown). However, a statistically significant difference
370 Plastic and Aesthetic Research ¦ Volume 3 ¦ December 14, 2016