
Page 275 - Read Online
P. 275
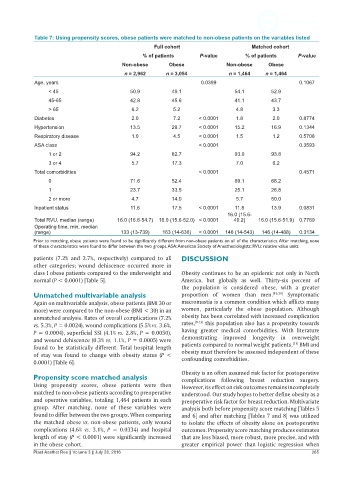
Table 7: Using propensity scores, obese patients were matched to non-obese patients on the variables listed
                                                     Full cohort                      Matched cohort
                                                    % of patients   P-value           % of patients   P-value
                                          Non-obese       Obese              Non-obese      Obese
                                           n = 2,962     n = 3,054            n = 1,464    n = 1,464
             Age, years                                              0.0399                           0.1067
                 < 45                        50.9          49.1                 54.1        52.9
                 45-65                       42.8          45.6                 41.1        43.7
                 > 65                        6.2           5.2                   4.8         3.3
             Diabetes                        2.0           7.2      < 0.0001     1.8         2.0      0.8774
             Hypertension                    13.5          29.7     < 0.0001    15.2        16.9      0.1344
             Respiratory disease             1.0           4.5      < 0.0001     1.5         1.2      0.5708
             ASA class                                              < 0.0001                          0.3593
                 1 or 2                      94.2          82.7                 93.0        93.8
                 3 or 4                      5.7           17.3                  7.0         6.2
             Total comorbidities                                    < 0.0001                          0.4571
                 0                           71.6          52.4                 69.1        68.2
                 1                           23.7          33.5                 25.1        26.8
                 2 or more                   4.7           14.0                  5.7        50.0
             Inpatient status                11.6          17.5     < 0.0001    11.8        13.9      0.0831
                                                                              16.0 (15.6-
             Total RVU, median (range)   16.0 (16.6-54.7)  16.0 (15.6-52.0) < 0.0001  49.2)  16.0 (15.6-51.9)  0.7769
             Operating time, min, median
             (range)                      133 (13-739)  163 (14-636)  < 0.0001  146 (14-543)  146 (14-488)  0.3134
            Prior to matching, obese patients were found to be significantly different from non-obese patients on all of the characteristics. After matching, none
            of these characteristics were found to differ between the two groups. ASA: American Society of Anesthesiologists; RVU: relative value units

            patients  (7.2% and 2.7%, respectively) compared to all   DISCUSSION
            other categories; wound dehiscence occurred more in
            class I obese patients compared to the underweight and   Obesity continues to be an epidemic not only in North
            normal (P < 0.0001) [Table 5].                    America,  but  globally as  well.  Thirty-six  percent  of
                                                              the population is considered obese, with a greater
            Unmatched multivariable analysis                  proportion of women than men.  [19,20]  Symptomatic
            Again on multivariable analysis, obese patients (BMI 30 or   macromastia is a common condition which afflicts many
            more) were compared to the non-obese (BMI < 30) in an   women, particularly  the obese population.  Although
            unmatched analysis. Rates of overall complications (7.2%   obesity has been correlated with increased complication
            vs. 5.3%, P = 0.0024), wound complications (5.5% vs. 3.6%,   rates, [9-13]  this population also has a propensity towards
            P = 0.0004), superficial SSI (4.1% vs. 2.8%, P = 0.0050),   having greater medical comorbidities.  With literature
            and wound dehiscence (0.3% vs. 1.1%, P = 0.0005) were   demonstrating improved longevity in overweight
                                                                                                    [21]
            found to be statistically different. Total hospital length   patients compared to normal weight patients,  BMI and
            of stay  was  found to  change  with  obesity  status  (P  <   obesity must therefore be assessed independent of these
                                                              confounding comorbidities.
            0.0001) [Table 6].
                                                              Obesity is an often assumed risk factor for postoperative
            Propensity score matched analysis                 complications following breast reduction surgery.
            Using propensity scores,  obese  patients were then   However, its effect on risk outcomes remains incompletely
            matched to non-obese patients according to preoperative   understood. Our study hopes to better define obesity as a
            and operative variables, totaling 1,464 patients in each   preoperative risk factor for breast reduction. Multivariate
            group. After matching,  none of these  variables were   analysis both before propensity score matching [Tables 5
            found to differ between the two groups. When comparing   and 6] and after matching [Tables 7 and 8] was utilized
            the matched obese vs. non-obese patients, only wound   to isolate the effects of obesity alone on postoperative
            complications (4.6%  vs. 3.1%,  P = 0.0334)  and hospital   outcomes. Propensity score matching produces estimates
            length of stay (P < 0.0001) were significantly increased   that are less biased, more robust, more precise, and with
            in the obese cohort.                              greater empirical power than logistic regression when
            Plast Aesthet Res || Volume 3 || July 28, 2016                                                265