
Page 273 - Read Online
P. 273
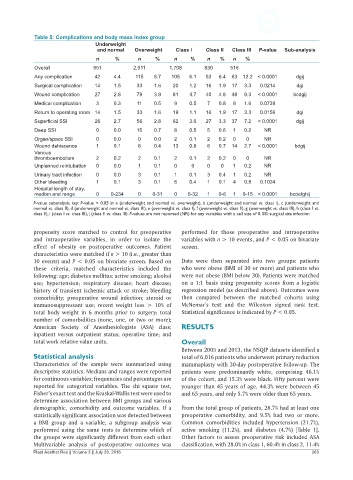
Table 5: Complications and body mass index group
                                 Underweight
                                  and normal  Overweight    Class I   Class II  Class III  P-value  Sub-analysis
                                 n      %       n    %      n    %     n   %    n   %
             Overall             951          2,011       1,708       830      516
             Any complication    42    4.4     115   5.7   105   6.1  53   6.4  63  12.2  < 0.0001   dgij
             Surgical complication  14  1.5    33    1.6   20    1.2  16   1.9  17  3.3  0.0214      dgi
             Wound complication  27    2.8     79    3.9   81    4.7  40   4.8  48  9.3  < 0.0001   bcdgij
             Medical complication  3   0.3     11    0.5    9    0.5   7   0.8  8  1.6   0.0739
             Return to operating room 14  1.5  33    1.6   19    1.1  16   1.9  17  3.3  0.0156      dgi
             Superficial SSI     26    2.7     56    2.8   62    3.6  27   3.3  37  7.2  < 0.0001    dgij
             Deep SSI            0     0.0     15    0.7    8    0.5   5   0.6  1  0.2    NR
             Organ/space SSI     0     0.0      0    0.0    2    0.1   2   0.2  0   0     NR
             Wound dehiscence    1     0.1      8    0.4   13    0.8   6   0.7  14  2.7  < 0.0001   bdgij
             Venous
             thromboembolism     2     0.2      2    0.1    2    0.1   2   0.2  0   0     NR
             Unplanned reintubation  0  0.0     1    0.1    0     0    0    0   1  0.2    NR
             Urinary tract infection  0  0.0    3    0.1    1    0.1   3   0.4  1  0.2    NR
             Other bleeding      1     0.1      3    0.1    6    0.4   1   0.1  4  0.8   0.1024
             Hospital length of stay,
             median and range    0    0-234     0   0-31    0   0-32   1   0-6  1  0-15  < 0.0001  bcdefghij
            P-value subanalysis key: P-value < 0.05 in a (underweight and normal vs. overweight), b (underweight and normal vs. class I), c (underweight and
            normal vs. class II), d (underweight and normal vs. class III), e (overweight vs. class I), f (overweight vs. class II), g (overweight vs. class III), h (class I vs.
            class II), i (class I vs. class III), j (class II vs. class III). P-values are not reported (NR) for any variables with a cell size of 0. SSI: surgical site infection


            propensity  score  matched to control for preoperative   performed for those preoperative and intraoperative
            and intraoperative variables, in order to isolate the   variables with n > 10 events, and P < 0.05 on bivariate
            effect of obesity  on postoperative outcomes. Patient   screen.
            characteristics were matched if n > 10 (i.e., greater than
            10 events) and P < 0.05 on bivariate screen. Based on   Data were then separated  into two groups:  patients
            these  criteria,  matched characteristics included the   who were obese (BMI of 30 or more) and patients who
            following: age; diabetes mellitus; active smoking; alcohol   were not obese (BMI below 30). Patients were matched
            use; hypertension; respiratory  disease; heart  disease;   on a 1:1 basis using propensity scores from a logistic
            history of transient ischemic attack or stroke; bleeding   regression model (as described above). Outcomes were
            comorbidity; preoperative wound infection; steroid or   then compared between  the matched cohorts using
            immunosuppressant use; recent weight loss > 10%  of   McNemar’s  test  and the  Wilcoxon signed  rank test.
            total body weight in 6 months prior to surgery; total   Statistical significance is indicated by P < 0.05.
            number of comorbidities (none, one, or two or more);
            American  Society  of Anesthesiologists  (ASA) class;   RESULTS
            inpatient  versus  outpatient  status;  operative  time;  and
            total work relative value units.                  Overall
                                                              Between 2005 and 2013, the NSQIP datasets identified a
            Statistical analysis                              total of 6,016 patients who underwent primary reduction
            Characteristics  of the  sample  were  summarized  using   mammaplasty with 30-day postoperative follow-up. The
            descriptive statistics. Medians and ranges were reported   patients  were  predominantly  white,  comprising  46.1%
            for continuous variables; frequencies and percentages are   of the cohort, and 15.3% were black. Fifty percent were
            reported for categorical variables. The chi square test,   younger than 45 years of age, 44.3% were between 45
            Fisher’s exact test and the Kruskal-Wallis test were used to   and 65 years, and only 5.7% were older than 65 years.
            determine association between BMI groups and various
            demographic, comorbidity and outcome variables. If a   From the total group of patients, 28.7% had at least one
            statistically significant association was detected between   preoperative comorbidity, and 9.5%  had two or more.
            a BMI group and a variable, a subgroup analysis was   Common  comorbidities  included hypertension  (21.7%),
            performed using the same tests to determine which of   active  smoking  (11.2%), and diabetes  (4.7%) [Table  1].
            the groups were significantly different from each other.   Other factors to assess preoperative risk included ASA
            Multivariable analysis of postoperative outcomes was   classification, with 28.0% in class 1, 60.4% in class 2, 11.4%
            Plast Aesthet Res || Volume 3 || July 28, 2016                                                263