
Page 274 - Read Online
P. 274
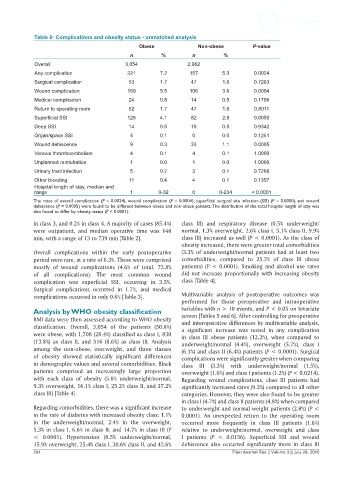
Table 6: Complications and obesity status - unmatched analysis
                                                Obese               Non-obese         P-value
                                             n         %          n         %
             Overall                       3,054                2,962
             Any complication               221        7.2       157        5.3        0.0024
             Surgical complication          53         1.7       47         1.6        0.7263
             Wound complication             169        5.5       106        3.6        0.0004
             Medical complication           24         0.8       14         0.5        0.1706
             Return to operating room       52         1.7       47         1.6        0.8011
             Superficial SSI                126        4.1       82         2.8        0.0050
             Deep SSI                       14         0.5       15         0.5        0.9342
             Organ/space SSI                 4         0.1        0         0.0        0.1251
             Wound dehiscence                9         0.3       33         1.1        0.0005
             Venous thromboembolism          4         0.1        4         0.1        1.0000
             Unplanned reintubation          1         0.0        1         0.0        1.0000
             Urinary tract infection         5         0.2        3         0.1        0.7266
             Other bleeding                  11        0.4        4         0.1        0.1357
             Hospital length of stay, median and
             range                           1        0-32        0        0-234      < 0.0001
            The rates of overall complication (P = 0.0024), wound complication (P = 0.0004), superficial surgical site infection (SSI) (P = 0.0050), and wound
            dehiscence (P = 0.0005) were found to be different between obese and non-obese patients. The distribution of the total hospital length of stay was
            also found to differ by obesity status (P < 0.0001).
            in class 3, and 0.2% in class 4. A majority of cases (85.4%)   class  III) and respiratory disease (0.5%  underweight/
            were outpatient, and median operative time was 148   normal, 1.3% overweight, 2.6% class I, 5.1% class II, 9.9%
            min, with a range of 13 to 739 min [Table 2].     class III) increased as well (P < 0.0001). As the class of
                                                              obesity increased, there were greater total comorbidities
            Overall complications within the early postoperative   (3.3% of underweight/normal  patients  had at  least  two
            period were rare, at a rate of 6.3%. These were comprised   comorbidities,  compared to 25.2% of class III  obese
            mostly  of wound complications (4.6% of total, 72.8%   patients) (P < 0.0001).  Smoking and alcohol  use rates
            of all complications). The most  common wound     did not increase proportionally with increasing obesity
            complication was superficial SSI, occurring in 3.5%.   class [Table 4].
            Surgical complications occurred in  1.7%, and medical
            complications occurred in only 0.6% [Table 3].    Multivariable analysis of postoperative outcomes was
                                                              performed for those preoperative and intraoperative
            Analysis by WHO obesity classification            variables with n > 10 events, and P < 0.05 on bivariate
            BMI data were then assessed according to WHO obesity   screen [Tables 5 and 6]. After controlling for preoperative
                                                              and interoperative differences by multivariable analysis,
            classification. Overall, 3,054 of the patients (50.8%)   a  significant  increase  was  noted  in  any  complication
            were obese, with 1,708 (28.4%) classified as class I, 830   in class III obese patients (12.2%), when compared to
            (13.8%)  as  class  II,  and  516  (8.6%)  as  class  III.  Analysis   underweight/normal  (4.4%), overweight  (5.7%), class I
            among  the  non-obese,  overweight,  and  three  classes   (6.1%) and class II (6.4%) patients (P < 0.0001). Surgical
            of obesity showed statistically significant differences   complications were significantly greater when comparing
            in demographic values and several comorbidities. Black   class III  (3.3%) with  underweight/normal  (1.5%),
            patients comprised an increasingly large proportion   overweight (1.6%) and class I patients (1.2%) (P < 0.0214).
            with each class of obesity (5.8% underweight/normal,   Regarding wound complications, class III patients had
            9.3% overweight, 16.1% class I, 25.2% class II, and 37.2%   significantly increased rates (9.3%) compared to all other
            class III) [Table 4].                             categories. However, they were also found to be greater
                                                              in class I (4.7%) and class II patients (4.8%) when compared
            Regarding comorbidities, there was a significant increase   to underweight and normal weight patients (2.8%) (P <
            in the rate of diabetes with increased obesity class: 1.1%   0.0001). An  unexpected return  to  the  operating  room
            in the underweight/normal,  2.4% in the overweight,   occurred more frequently in class  III patients (1.6%)
            5.3% in class I, 6.6% in class II, and 14.7% in class III (P   relative  to underweight/normal,  overweight  and class
            < 0.0001).  Hypertension (8.5% underweight/normal,   I patients (P < 0.0156).  Superficial SSI and wound
            15.9% overweight, 25.4% class I, 30.6% class II, and 42.6%   dehiscence also occurred significantly more in class  III
            264                                                                Plast Aesthet Res || Volume 3 || July 28, 2016