
Page 272 - Read Online
P. 272
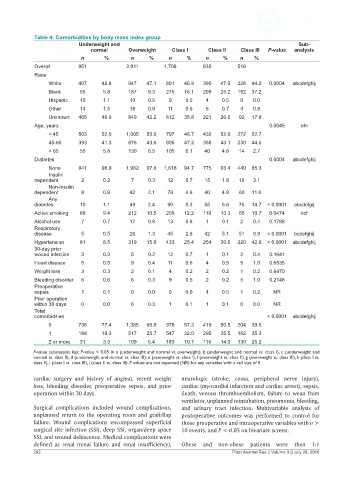
Table 4: Comorbidities by body mass index group
                            Underweight and                                                           Sub-
                                normal      Overweight     Class I     Class II   Class III  P-value  analysis
                            n       %        n     %      n     %     n     %     n    %
             Overall       951              2,011       1,708         830        516
             Race
                 White     407     42.8     947   47.1   801   46.9   390  47.0  228  44.2  0.0004  abcdefghij
                 Black      55      5.8     187    9.3   275   16.1   209  25.2  192  37.2
                 Hispanic   10      1.1      10    0.5    9     0.5   4     0.5   0   0.0
                 Other      14      1.5      18    0.9    11    0.6   6     0.7   4   0.8
                 Unknown    465    48.9     849   42.2   612   35.8   221  26.6   92  17.8
             Age, years                                                                     0.0045    bhi
                 < 45       503    52.9     1,005  50.0  797   46.7   432  52.0  272  52.7
                 45-65      393    41.3     876   43.6   806   47.2   358  43.1  230  44.6
                 > 65       55      5.8     130    6.5   105    6.1   40    4.8   14  2.7
             Diabetes                                                                       0.0004  abcdefghij
                 None       941    98.9     1,962  97.6  1,618  94.7  775  93.4  440  85.3
                 Insulin
             dependent      2       0.2      7     0.3    12    0.7   15    1.8   16  3.1
                 Non-insulin
             dependent      8       0.8      42    2.1    78    4.6   40    4.8   60  11.6
                 Any
             diabetes       10      1.1      49    2.4    90    5.3   55    6.6   76  14.7  < 0.0001  abcdefgij
             Active smoking  89     9.4     212   10.5   209   12.2   110  13.3   55  10.7  0.0474    bcf
             Alcohol use    7       0.7      17    0.8    13    0.8   1     0.1   2   0.4   0.1788
             Respiratory
             disease        5       0.5      26    1.3    45    2.6   42    5.1   51  9.9  < 0.0001  bcdefghij
             Hypertension   81      8.5     319   15.9   433   25.4   254  30.6  220  42.6  < 0.0001  abcdefghij
             30-day prior
             wound infection  3     0.3      5     0.2    12    0.7   1     0.1   2   0.4   0.1641
             Heart disease  5       0.5      9     0.4    11    0.6   4     0.5   5   1.0   0.6535
             Weight loss    3       0.3      2     0.1    4     0.2   2     0.2   1   0.2   0.6470
             Bleeding disorder  6   0.6      6     0.3    9     0.5   2     0.2   5   1.0   0.2148
             Preoperative
             sepsis         1       0.1      0     0.0    0     0.0   4     0.5   1   0.2    NR
             Prior operation
             within 30 days  0      0.0      6     0.3    1     0.1   1     0.1   0   0.0    NR
             Total
             comorbidities                                                                 < 0.0001  abcdefghij
                 0         736     77.4     1,385  68.9  978   57.3   419  50.5  204  39.5
                 1         184     19.3     517   25.7   547   32.0   295  35.5  182  35.3
                 2 or more  31      3.3     109    5.4   183   10.7   116  14.0  130  25.2

            P-value subanalysis key: P-value < 0.05 in a (underweight and normal vs. overweight), b (underweight and normal vs. class I), c (underweight and
            normal vs. class II), d (underweight and normal vs. class III), e (overweight vs. class I), f (overweight vs. class II), g (overweight vs. class III), h (class I vs.
            class II), i (class I vs. class III), j (class II vs. class III). P-values are not reported (NR) for any variables with a cell size of 0

            cardiac surgery  and history  of angina),  recent weight   neurologic (stroke, coma, peripheral nerve injury),
            loss,  bleeding  disorder,  preoperative  sepsis,  and prior   cardiac (myocardial infarction and cardiac arrest), sepsis,
            operation within 30 days.                         death, venous thromboembolism, failure to wean from
                                                              ventilator, unplanned reintubation, pneumonia, bleeding,
            Surgical complications included wound complications,   and urinary tract infection. Multivariable analysis of
            unplanned return to the operating room and graft/flap   postoperative outcomes was performed to control for
            failure.  Wound complications encompassed superficial   those preoperative and intraoperative variables with n >
            surgical site infection (SSI), deep SSI, organ/deep space   10 events, and P < 0.05 on bivariate screen.
            SSI, and wound dehiscence. Medical complications were
            defined  as  renal  (renal  failure  and renal  insufficiency),   Obese  and non-obese  patients  were then 1:1
            262                                                                Plast Aesthet Res || Volume 3 || July 28, 2016