
Page 67 - Read Online
P. 67
Page 4 of 9 Hsu et al. Neuroimmunol Neuroinflammation 2018;5:9 I http://dx.doi.org/10.20517/2347-8659.2018.03
Table 1. Country/region distribution based on the 1st author for papers published in neuroimmunology and neuroinflammation
Country/region 1982-2008 2009 2010 2011 2012 2013 2014 2015 2016 2017 2018 Total % Growth
USA 148 28 35 41 56 74 81 79 84 115 13 902 32.23 0.42
China 5 2 5 7 12 24 38 47 73 128 17 363 12.97 0.67
Germany 23 4 6 10 9 17 17 20 18 26 1 174 6.22 0.43
Italy 19 2 6 9 11 7 15 9 17 33 4 151 5.39 0.51
Canada 26 3 8 7 7 11 12 13 14 16 1 144 5.14 0.35
India 5 5 4 8 5 9 9 21 24 2 97 3.47 0.57
UK 16 1 2 3 4 3 7 7 11 15 2 87 3.11 0.62
France 12 3 7 1 9 1 4 9 9 15 82 2.93 0.28
Spain 6 2 6 2 4 7 12 7 11 17 1 81 2.89 0.45
The Netherlands 11 2 7 4 8 3 8 3 6 7 70 2.50 -0.12
Brazil 1 1 3 2 1 4 5 12 8 17 6 61 2.18 0.73
Australia 1 1 8 3 5 7 12 6 15 1 60 2.14 0.46
Japan 4 3 1 3 9 2 7 9 7 9 1 59 2.11 0.34
Taiwan 2 3 4 2 8 3 3 6 12 9 1 55 1.96 0.32
Sweden 7 1 5 3 4 4 6 4 7 48 1.71 0.26
Israel 9 2 1 2 2 2 3 2 3 1 1 37 1.32 -0.07
Belgium 3 2 2 2 5 3 1 6 1 28 1.00 0.48
Switzerland 3 1 2 1 3 1 2 5 5 1 27 0.96 0.56
Iran 0 4 2 1 1 5 2 9 24 0.86 0.40
Mexico 2 1 2 2 4 7 1 21 0.75 0.54
Others 17 7 7 8 13 18 23 26 44 45 3 228 8.15 0.55
Total 320 65 110 121 174 196 264 286 360 526 57 2799 100.00 0.55
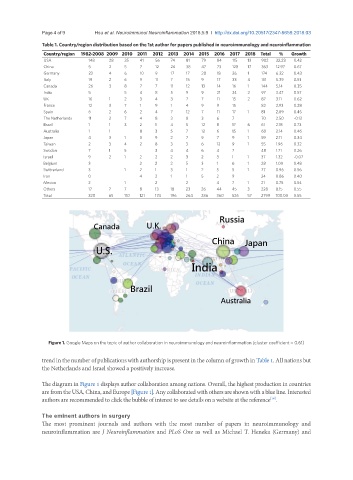
Figure 1. Google Maps on the topic of author collaboration in neuroimmunology and neuroinflammation (cluster coefficient = 0.61)
trend in the number of publications with authorship is present in the column of growth in Table 1. All nations but
the Netherlands and Israel showed a positively increase.
The diagram in Figure 1 displays author collaboration among nations. Overall, the highest production in countries
are from the USA, China, and Europe [Figure 1]. Any collaborated with others are shown with a blue line. Interested
authors are recommended to click the bubble of interest to see details on a website at the reference .
[18]
The eminent authors in surgery
The most prominent journals and authors with the most number of papers in neuroimmunology and
neuroinflammation are J Neuroinflammation and PLoS One as well as Michael T. Heneka (Germany) and