
Page 69 - Read Online
P. 69
Page 6 of 9 Hsu et al. Neuroimmunol Neuroinflammation 2018;5:9 I http://dx.doi.org/10.20517/2347-8659.2018.03
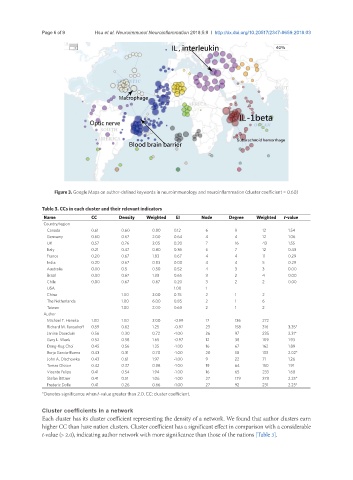
Figure 3. Google Maps on author-defined keywords in neuroimmunology and neuroinflammation (cluster coefficient = 0.60)
Table 3. CCs in each cluster and their relevant indicators
Name CC Density Weighted EI Node Degree Weighted t-value
Country/region
Canada 0.61 0.60 0.80 0.12 6 9 12 1.54
Germany 0.60 0.67 2.00 0.64 4 4 12 1.06
UK 0.57 0.76 2.05 0.20 7 16 43 1.55
Italy 0.21 0.47 0.80 0.36 6 7 12 0.43
France 0.20 0.67 1.83 0.67 4 4 11 0.29
India 0.20 0.67 0.83 0.00 4 4 5 0.29
Australia 0.00 0.5 0.50 0.52 4 3 3 0.00
Brazil 0.00 0.67 1.33 0.65 3 2 4 0.00
Chile 0.00 0.67 0.67 0.20 3 2 2 0.00
USA 1.00 1
China 1.00 2.00 0.75 2 1 2
The Netherlands 1.00 6.00 0.85 2 1 6
Taiwan 1.00 2.00 0.60 2 1 2
Author
Michael T. Heneka 1.00 1.00 2.00 -0.99 17 136 272
Richard M. Ransohoff 0.59 0.62 1.25 -0.97 23 158 316 3.35*
Janine Doorduin 0.56 0.30 0.72 -1.00 26 97 235 3.31*
Gary L. Wenk 0.52 0.58 1.65 -0.97 12 38 109 1.93
Dong-Kug Choi 0.45 0.56 1.35 -1.00 16 67 162 1.89
Borja Garcia-Bueno 0.43 0.31 0.70 -1.00 20 58 133 2.02*
John A. Olschowka 0.43 0.61 1.97 -1.00 9 22 71 1.26
Tomas Olsson 0.42 0.37 0.88 -1.00 19 64 150 1.91
Vicente Felipo 0.41 0.54 1.94 -1.00 16 65 233 1.68
Stefan Bittner 0.41 0.51 1.06 -1.00 27 179 373 2.25*
Frederic Dolle 0.41 0.26 0.66 -1.00 27 92 231 2.25*
*Denotes significance when t-value greater than 2.0. CC: cluster coefficient.
Cluster coefficients in a network
Each cluster has its cluster coefficient representing the density of a network. We found that author clusters earn
higher CC than have nation clusters. Cluster coefficient has a significant effect in comparison with a considerable
t-value (> 2.0), indicating author network with more significance than those of the nations [Table 3].