
Page 242 - Read Online
P. 242
Page 4 of 10 Raevsky et al. Neuroimmunol Neuroinflammation 2018;5:33 I http://dx.doi.org/10.20517/2347-8659.2018.34
A B
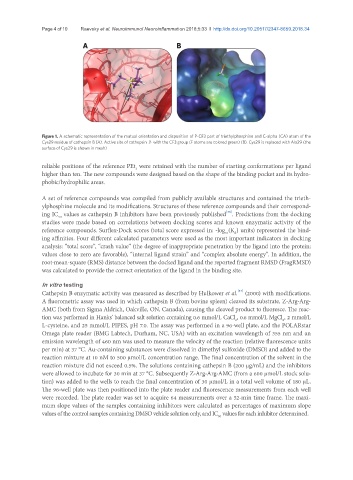
Figure 1. A schematic representation of the mutual orientation and disposition of P-CF3 part of triethylphosphine and C-alpha (CA) atom of the
Cys29 residue of cathepsin B (A). Active site of cathepsin В with the CF3 group (F atoms are colored green) (B). Cys29 is replaced with Ala29 (the
surface of Cys29 is shown in mesh)
reliable positions of the reference PEt were retained with the number of starting conformations per ligand
3
higher than ten. The new compounds were designed based on the shape of the binding pocket and its hydro-
phobic/hydrophilic areas.
A set of reference compounds was compiled from publicly available structures and contained the trieth-
ylphosphine molecule and its modifications. Structures of these reference compounds and their correspond-
[36]
ing IC values as cathepsin B inhibitors have been previously published . Predictions from the docking
50
studies were made based on correlations between docking scores and known enzymatic activity of the
reference compounds. Surflex-Dock scores (total score expressed in: -log (K ) units) represented the bind-
d
10
ing affinities. Four different calculated parameters were used as the most important indicators in docking
analysis: “total score”, “crash value” (the degree of inappropriate penetration by the ligand into the protein;
values close to zero are favorable), “internal ligand strain” and “complex absolute energy”. In addition, the
root-mean-square (RMS) distance between the docked ligand and the reported fragment RMSD (FragRMSD)
was calculated to provide the correct orientation of the ligand in the binding site.
In vitro testing
[37]
Cathepsin B enzymatic activity was measured as described by Hulkower et al. (2000) with modifications.
A fluorometric assay was used in which cathepsin B (from bovine spleen) cleaved its substrate, Z-Arg-Arg-
AMC (both from Sigma Aldrich, Oakville, ON, Canada), causing the cleaved product to fluoresce. The reac-
tion was performed in Hanks’ balanced salt solution containing 0.6 mmol/L CaCl , 0.6 mmol/L MgCl , 2 mmol/L
2
2
L-cysteine, and 25 mmol/L PIPES, pH 7.0. The assay was performed in a 96-well plate, and the POLARstar
Omega plate reader (BMG Labtech, Durham, NC, USA) with an excitation wavelength of 355 nm and an
emission wavelength of 460 nm was used to measure the velocity of the reaction (relative fluorescence units
per min) at 37 °C. Au-containing substances were dissolved in dimethyl sulfoxide (DMSO) and added to the
reaction mixture at 10 nM to 500 μmol/L concentration range. The final concentration of the solvent in the
reaction mixture did not exceed 0.5%. The solutions containing cathepsin B (200 μg/mL) and the inhibitors
were allowed to incubate for 30 min at 37 °C. Subsequently Z-Arg-Arg-AMC (from a 600 μmol/L stock solu-
tion) was added to the wells to reach the final concentration of 30 μmol/L in a total well volume of 180 μL.
The 96-well plate was then positioned into the plate reader and fluorescence measurements from each well
were recorded. The plate reader was set to acquire 64 measurements over a 52-min time frame. The maxi-
mum slope values of the samples containing inhibitors were calculated as percentages of maximum slope
values of the control samples containing DMSO vehicle solution only, and IC values for each inhibitor determined.
50