
Page 191 - Read Online
P. 191
Lai et al. Imbalance of NK and B cell subsets in GMG exacerbation
will lead to of muscle weakness in MG patients. Among 14.03 ± 2.36, Table 5, Figure 3), suggesting that the
the predisposing factors, infections were the most NK cells may be consumed by infections or by a similar
frequently identified for symptomatic exacerbation mechanism during deterioration of muscle weakness.
in our study [Table 5]. So, we have further analyzed Furthermore, the difference in NK cells percentages
peripheral blood lymphocyte subsets in the patients between the patients in exacerbation with infections
with infections at the exacerbation stage. Our and the cases in remission was significant (P = 0.028),
data showed that the patients with infections had but the difference between the patients in exacerbation
significantly lower percentage of NK cells those without infections and the cases in remission was
without infections during exacerbation (10.97 ± 1.74; not statistically significant [Table 5; Figure 3]. The
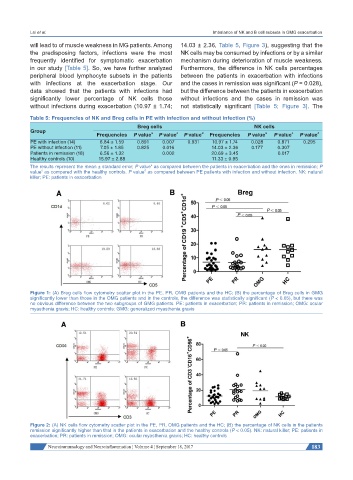
Table 5: Frequencies of NK and Breg cells in PE with infection and without infection (%)
Breg cells NK cells
Group
Frequencies P value a P value c P value d Frequencies P value a P value c P value d
PE with infection (14) 6.84 ± 1.59 0.891 0.007 0.931 10.97 ± 1.74 0.028 0.871 0.295
PE without infection (11) 7.05 ± 1.85 0.825 0.016 14.03 ± 2.36 0.177 0.307
Patients in remission (18) 6.56 ± 1.32 0.002 20.69 ± 3.45 0.017
Healthy controls (10) 15.97 ± 2.88 11.33 ± 0.95
a
The results represent the mean ± standard error; P value as compared between the patients in exacerbation and the ones in remission; P
c
d
value as compared with the healthy controls. P value as compared between PE patients with infection and without infection. NK: natural
killer; PE: patients in exacerbation
Figure 1: (A) Breg cells flow cytometry scatter plot in the PE, PR, OMG patients and the HC; (B) the percentage of Breg cells in GMG
significantly lower than those in the OMG patients and in the controls, the difference was statistically significant (P < 0.05), but there was
no obvious difference between the two subgroups of GMG patients. PE: patients in exacerbation; PR: patients in remission; OMG: ocular
myasthenia gravis; HC: healthy controls; GMG: generalized myasthenia gravis
Figure 2: (A) NK cells flow cytometry scatter plot in the PE, PR, OMG patients and the HC; (B) the percentage of NK cells in the patients
remission significantly higher than that in the patients in exacerbation and the healthy controls (P < 0.05). NK: natural killer; PE: patients in
exacerbation; PR: patients in remission; OMG: ocular myasthenia gravis; HC: healthy controls
Neuroimmunology and Neuroinflammation ¦ Volume 4 ¦ September 18, 2017 183