
Page 68 - Read Online
P. 68
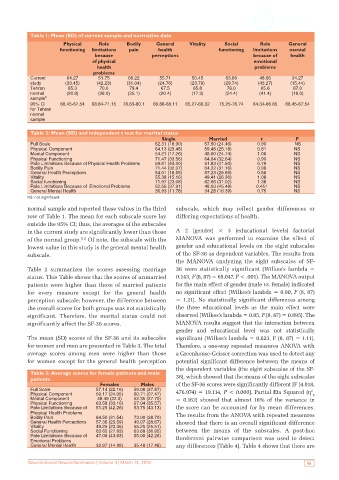
Table 1: Mean (SD) of current sample and normative data
                       Physical     Role      Bodily    General     Vitality    Social      Role      General
                      functioning  limitations   pain    health               functioning  limitations   mental
                                  because             perceptions                         because of   health
                                 of physical                                              emotional
                                   health                                                 problems
                                  problems
            Current     64.27       51.75     66.22      55.71      50.45       63.66       48.66       34.27
            study       (33.45)    (42.23)   (31.04)     (24.76)    (23.79)     (29.74)     (43.27)    (15.44)
            Tehran       85.3       70.0      79.4        67.5       65.8        76.0        65.6       67.0
            normal      (20.8)     (38.0)     (25.1)     (20.4)     (17.3)      (24.4)      (41.4)     (18.0)
            sample 8
            95% CI    66.45-67.54  68.84-71.15  78.63-80.1  66.88-68.11  65.27-66.32  75.25-76.74  64.34-66.85  66.45-67.54
            for Tehran
            normal
            sample
            Table 2: Mean (SD) and independent t test for marital status
                                                          Single          Married            t           P
            Full Scale                                 62.31 (18.90)     57.50 (24.46)     0.90          NS
            Physical Component                         64.13 (23.48)     59.48 (25.18)     0.81         NS
            Mental Component                           54.21 (17.26)     48.60 (24.74)     1.06         NS
            Physical Functioning                       71.47 (33.56)     64.64 (32.64)     0.90         NS
            Role Limitations Because of Physical Health Problems  59.61 (44.20)  51.83 (41.50)  0.79    NS
            Bodily Pain                                71.44 (32.07)     64.22 (31.16)     0.99         NS
            General Health Perceptions                 54.01 (18.55)     57.23 (26.69)     0.56         NS
            Vitality                                   55.38 (15.16)     49.41 (26.30)     1.08         NS
            Social functioning                         71.97 (23.08)     62.66 (31.02)     1.38         NS
            Role Limitations Because of  Emotional Problems  52.56 (37.91)  48.03 (45.48)  0.451        NS
            General Mental Health                       36.93 (11.78)    34.28 (16.39)     0.75         NS
           NS: not significant
           normal sample and reported these values in the third   subscale,  which  may reflect gender differences  or
           row of Table 1. The mean for each subscale score lay   differing expectations of health.
           outside the 95% CI; thus, the averages of the subscales
           in the current study are significantly lower than those   A 2  (gender)  ×  3  (educational  levels)  factorial
           of the normal group.  Of note, the subscale with the   MANOVA  was performed to examine the effect of
                             [11]
           lowest value in this study is the general mental health   gender and educational levels on the eight subscales
           subscale.                                           of the SF-36 as dependent variables. The results from
                                                               the MANOVA analyzing the eight subscales of SF-
           Table 2 summarizes the scores assessing marriage    36 were statistically significant (Wilkes’s lambda =
           status. This Table shows that the scores of unmarried   0.143, F (8, 87) = 65.047, P < .001). The MANOVA output
           patients were higher than those of married patients   for the main effect of gender (male vs. female) indicated
           for every measure except for the general health     no significant effect (Wilkes’s lambda = 0.90, F (8, 87)
           perception subscale; however, the difference between   = 1.21). No statistically significant differences among
           the overall scores for both groups was not statistically   the three  educational  levels as the  main  effect  were
           significant. Therefore, the marital status could not   observed (Wilkes’s lambda = 0.85, F (8, 87) = 0.895). The
           significantly affect the SF-36 scores.              MANOVA results suggest that the interaction between
                                                               gender and educational level was not statistically
           The mean (SD) scores of the SF-36 and its subscales   significant (Wilkes’s lambda = 0.823, F (8, 87) = 1.11).
           for women and men are presented in Table 3. The total   Therefore, a one-way repeated measures ANOVA with
           average scores among men were higher than those     a Greenhouse-Geisser correction was used to detect any
           for women except for the general health perception   potential significant difference between the means of
                                                               the dependent variables (the eight subscales of the SF-
            Table 3: Average scores for female patients and male
            patients                                           36), which showed that the means of the eight subscales
                                    Females        Males       of the SF-36 scores were significantly different [F (4.818,
            Full Scale             57.14 (22.16)  59.08 (27.87)  476.974) = 19.114, P < 0.000]. Partial Eta Squared (η
                                                                                                              2
            Physical Component     59.17 (24.05)  60.71 (27.47)                                                p
            Mental Component       48.49 (22.0)  52.35 (27.70)  = 0.162) showed that almost 16%  of the variance in
            Physical Functioning   63.58 (33.10)  67.04 (35.57)
            Role Limitations Because of   51.25 (42.26)  53.75 (43.13)  the score can be accounted for by mean differences.
            Physical Health Problems                           The results from the ANOVA with repeated measures
            Bodily Pain            64.50 (31.54)  73.00 (28.70)
            General Health Perceptions  57.36 (23.59)  49.07 (28.67)  showed that there is an overall significant difference
            Vitality               49.25 (23.35)  55.25 (25.51)
            Social Functioning     63.65 (27.93)  63.68 (36.95)  between the means of the subscales. A post-hoc
            Role Limitations Because of   47.08 (43.63)  55.00 (42.26)  Bonferroni pairwise  comparison was used to detect
            Emotional Problems
            General Mental Health  33.97 (14.99)  35.48 (17.48)  any differences [Table 4]. Table 4 shows that there are

           Neuroimmunol Neuroinflammation | Volume 3 | March 14, 2016                                        59