
Page 185 - Read Online
P. 185
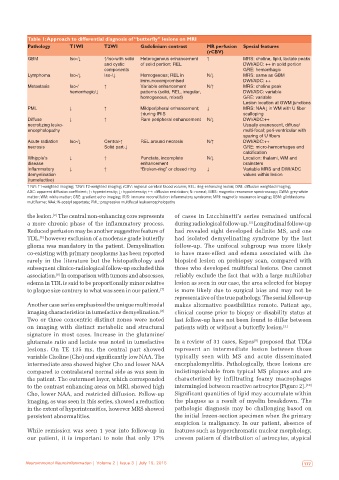
Table 1: Approach to differential diagnosis of “butterfly” lesions on MRI
           Pathology      T1WI        T2WI        Gadolinium contrast     MR perfusion   Special features
                                                                          (rCBV)
           GBM            Iso‑/↓      ↑/Iso‑with solid   Heterogenous enhancement   ↑  MRS: choline, lipid, lactate peaks
                                      and cystic   of solid portion; REL              DWI/ADC: ++ in solid portion
                                      components                                      GRE: hemorrhagic
           Lymphoma       Iso‑/↓      Iso‑/↓      Homogenous; REL in      N/↓         MRS: same as GBM
                                                  immunocompromised                   DWI/ADC: ++
           Metastasis     Iso‑/       ↑           Variable enhancement    N/↑         MRS: choline peak
                          hemorrhagic/↓           patterns (solid, REL, irregular,    DWI/ADC: variable
                                                  homogenous, mixed)                  GRE: variable
                                                                                      Lesion location at GWM junctions
           PML            ↓           ↑           Mildperipheral enhancement;   ↓     MRS: NAA↓ in WM with U fiber
                                                  ↑during IRIS                        scalloping
           Diffuse        ↓           ↑           Rare peripheral enhancement  N/↓    DWI/ADC:++
           necrotizing leuko‑                                                         Usually evanescent, diffuse/
           encephalopathy                                                             multi‑focal; peri‑ventricular with
                                                                                      sparing of U fibers
           Acute radiation   Iso‑/↓   Central‑↑   REL around necrosis     N/↑         DWI/ADC:++
           necrosis                   Solid part‑↓                                    GRE: micro‑hemorrhages and
                                                                                      calcification
           Whipple’s      ↓           ↑           Punctate, incomplete    N/↓         Location: thalami, WM and
           disease                                enhancement                         brainstem
           Inflammatory   ↓           ↑           “Broken‑ring” or closed ring  ↓     Variable MRS and DWI/ADC
           demyelination                                                              values within lesion
           (tumefactive)
           T1WI: T1‑weighted imaging; T2WI: T2‑weighted imaging; rCBV: regional cerebral blood volume; REL: ring‑enhancing lesion; DWI: diffusion weighted imaging;
           ADC: apparent diffusion coefficient; ↑: hyperintensity; ↓: hypointensity; ++: diffusion restriction; N: normal; MRS: magnetic resonance spectroscopy; GWM: grey‑white
           matter; WM: white matter; GRE: gradient echo imaging; IRIS: immune reconstitution inflammatory syndrome; MRI: magnetic resonance imaging; GBM: glioblastoma
           multiforme; NAA: N‑acetyl aspartate; PML: progressive multifocal leukoencephalopathy

           the lesion.  The central non-enhancing core represents   of cases in Lucchinetti’s series remained unifocal
                    [2]
                                                                                        [3]
           a more chronic phase of the inflammatory process.   during radiological follow-up.  Longitudinal follow-up
           Reduced perfusion may be another suggestive feature of   had revealed eight developed definite MS, and one
           TDL,  however exclusion of a moderate grade butterfly   had isolated demyelinating syndrome by the last
               [5]
           glioma was mandatory in the patient. Demyelination   follow-up. The unifocal subgroup was more likely
           co-existing with primary neoplasms has been reported   to have mass-effect and edema associated with the
           rarely  in  the  literature  but  the  histopathology  and   biopsied lesion on prebiopsy scan, compared with
           subsequent clinico-radiological follow-up excluded this   those who developed multifocal lesions. One cannot
           association.  In comparison with tumors and abscesses,   reliably exclude the fact that with a large multilobar
                     [6]
           edema in TDL is said to be proportionally minor relative   lesion as seen in our case, the area selected for biopsy
           to plaque size contrary to what was seen in our patient. [7]  is more likely due to surgical bias and may not be
                                                              representative of the true pathology. The serial follow-up
           Another case series emphasized the unique multimodal   makes alternative possibilities remote. Patient age,
           imaging characteristics in tumefactive demyelination.    clinical course prior to biopsy or disability status at
                                                         [8]
           Two or three concentric distinct zones were noted   last follow-up have not been found to differ between
           on imaging with distinct metabolic and structural   patients with or without a butterfly lesion. [3]
           signature in most cases. Increase in the glutamine/
                                                                                          [9]
           glutamate ratio and lactate was noted in tumefactive   In a review of 31 cases, Kepes  proposed that TDLs
           lesions. On TE 135 ms, the central part showed     represent an intermediate lesion between those
           variable Choline (Cho) and significantly low NAA. The   typically seen with MS and  acute  disseminated
           intermediate area showed higher Cho and lower NAA   encephalomyelitis. Pathologically, these lesions are
           compared to contralateral normal side as was seen in   indistinguishable from typical MS plaques and are
           the patient. The outermost layer, which corresponded   characterized  by  infiltrating  foamy  macrophages
           to the contrast enhancing areas on MRI, showed high   intermingled between reactive astrocytes [Figure 2]. [10]
           Cho, lower NAA, and restricted diffusion. Follow-up   Significant quantities of lipid may accumulate within
           imaging, as was seen in this series, showed a reduction   the plaques as a result of myelin breakdown. The
           in the extent of hyperintensities, however MRS showed   pathologic diagnosis may be challenging based on
           persistent abnormalities.                          the initial frozen-section specimen when the primary
                                                              suspicion is malignancy. In our patient, absence of
           While remission was seen 1 year into follow-up in   features such as hyperchromatic nuclear morphology,
           our patient, it is important to note that only 17%   uneven pattern of distribution of astrocytes, atypical


   176  Neuroimmunol Neuroinflammation | Volume 2 | Issue 3 | July 15, 2015  Neuroimmunol Neuroinflammation | Volume 2 | Issue 3 | July 15, 2015   177