
Page 184 - Read Online
P. 184
a b c
d e f
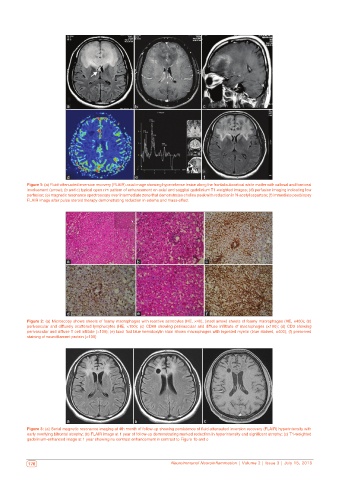
Figure 1: (a) Fluid‑attenuated inversion recovery (FLAIR) axial image showing hyperintense lesion along the frontal subcortical white matter with callosal and forniceal
involvement (arrow); (b and c) typical open rim pattern of enhancement on axial and saggital gadolinium T1‑weighted images; (d) perfusion imaging indicating low
perfusion; (e) magnetic resonance spectroscopy over intermediate zone that demonstrates choline peak with reduction in N‑acetyl aspartate; (f) immediate postbiopsy
FLAIR image after pulse steroid therapy demonstrating reduction in edema and mass‑effect
a b c
d e f
Figure 2: (a) Microscopy shows sheets of foamy macrophages with reactive astrocytes (HE, ×40); (inset arrow) sheets of foamy macrophages (HE, ×400); (b)
perivascular and diffusely scattered lymphocytes (HE, ×100); (c) CD68 showing perivascular and diffuse infiltrate of macrophages (×100); (d) CD3 showing
perivascular and diffuse T cell infiltate (×100); (e) luxol fast blue hematoxylin stain shows macrophages with ingested myelin (blue stained, ×400); (f) preserved
staining of neurofilament protein (×100)
a b c
Figure 3: (a) Serial magnetic resonance imaging at 4th month of follow‑up showing persistence of fluid‑attenuated inversion recovery (FLAIR) hyperintensity with
early overlying bifrontal atrophy; (b) FLAIR image at 1 year of follow‑up demonstrating marked reduction in hyperintensity and significant atrophy; (c) T1‑weighted
gadolinium‑enhanced image at 1 year showing no contrast enhancement in contrast to Figure 1b and c
176 Neuroimmunol Neuroinflammation | Volume 2 | Issue 3 | July 15, 2015 Neuroimmunol Neuroinflammation | Volume 2 | Issue 3 | July 15, 2015 177