
Page 37 - Read Online
P. 37
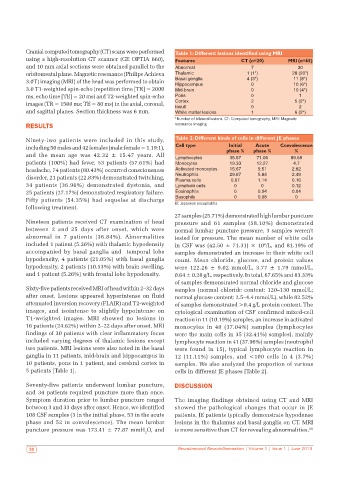
Cranial computed tomography (CT) scans were performed   Table 1: Different lesions identified using MRI
          using a high-resolution CT scanner (GE OPTIA 660),   Features               CT (n=20)       MRI (n=65)
          and 10 mm axial sections were obtained parallel to the   Abnormal              7                30
          orbitomeatal plane. Magnetic resonance (Philips Achieva   Thalamic            1 (1*)          28 (20*)
          3.0T) imaging (MRI) of the head was performed to obtain   Basal ganglia       4 (3*)          11 (8*)
                                                                                         0
                                                               Hippocampus
                                                                                                        10 (6*)
          3.0 T1-weighted spin-echo (repetition time [TR] = 2000   Mid-brain             0              10 (4*)
          ms, echo time [TE] = 20 ms) and T2-weighted spin-echo   Pons                   0                1
          images (TR = 1500 ms; TE = 80 ms) in the axial, coronal,   Cortex              2               5 (2*)
                                                                                                          2
                                                                                         0
                                                               Insult
          and sagittal planes. Section thickness was 6 mm.     White matter lesions      1               6 (2*)
                                                              *Number of bilateral lesions. CT: Computed tomography, MRI: Magnetic
          RESULTS                                             resonance imaging
          Ninety-two patients were included in this study,     Table 2: Different kinds of cells in different JE phases
                                                                                           Acute
                                                                                 Initial
          including 50 males and 42 females (male:female = 1.19:1),   Cell type  phase %  phase %  Convalescence
                                                                                                         %
          and the mean age was 42.32  ±  15.47  years. All     Lymphocytes        35.67    71.06       89.68
          patients (100%) had fever, 53 patients (57.61%) had   Monocytes         19.33    12.27        4.7
          headache, 74 patients (80.43%) occurred consciousness   Activated monocytes  15.67  9.51      2.82
          disorder, 21 patients (22.83%) demonstrated twitching,   Neutrophils    29.67     5.84        2.49
                                                               Plasma cells
                                                                                                        0.16
                                                                                            1.14
                                                                                  0.67
          34  patients  (36.96%) demonstrated dystonia,  and   Lymphoid cells      0         0          0.12
          25 patients (27.17%) demonstrated respiratory failure.   Eosinophils     0        0.04        0.04
          Fifty patients  (54.35%) had sequelae at discharge   Basophils           0        0.08         0
          following treatment.                                JE: Japanese encephalitis
                                                              27 samples (25.71%) demonstrated high lumbar puncture
          Nineteen patients received CT examination of head   pressure and 61  samples  (58.10%) demonstrated
          between 2 and 25  days after onset, which were      normal lumbar puncture pressure, 3 samples weren’t
          abnormal in 7 patients  (36.84%). Abnormalities     tested for pressure. The mean number of white cells
          included 1 patient (5.26%) with thalamic hypodensity   in CSF was (42.50 ± 71.31) × 10 /L, and 81.19% of
                                                                                              6
          accompanied by basal ganglia and  temporal lobe     samples demonstrated an increase in their white cell
          hypodensity, 4 patients (21.05%) with basal ganglia   count. Mean chloride, glucose, and protein values
          hypodensity, 2 patients (10.53%) with brain swelling,   were 122.26 ± 9.02 mmol/L, 3.77 ± 1.79 mmol/L,
          and 1 patient (5.26%) with frontal lobe hypodensity.  0.64 ± 0.28 g/L, respectively. In total, 67.65% and 83.33%
                                                              of samples demonstrated normal chloride and glucose
          Sixty-five patients received MRI of head within 2–32 days   samples (normal chloride content: 120–130 mmol/L;
          after onset. Lesions appeared hyperintense on fluid   normal glucose content: 2.5–4.4 mmol/L), while 82.52%
          attenuated inversion recovery (FLAIR) and T2-weighted   of samples demonstrated >0.4 g/L protein content. The
          images,  and  isointense  to  slightly  hypointense  on   cytological examination of CSF confirmed mixed-cell
          T1-weighted  images.  MRI  showed no lesions  in    reaction in 11 (10.19%) samples, an increase in activated
          16 patients (24.62%) within 2–22 days after onset. MRI   monocytes in 40 (37.04%) samples  (lymphocytes
          findings of 30 patients with clear inflammatory focus   were the main cells in 35 (32.41%) samples), mainly
          included varying degrees of thalamic lesions except   lymphocyte reaction in 41 (37.96%) samples (neutrophil
          two patients. MRI lesions were also noted in the basal   were found in 15), typical lymphocyte reaction in
          ganglia in 11 patients, mid-brain and hippocampus in   12  (11.11%) samples, and  <100  cells in 4 (3.7%)
          10 patients, pons in 1 patient, and cerebral cortex in   samples. We also analyzed the proportion of various
          5 patients [Table 1].                               cells in different JE phases [Table 2].


          Seventy-five patients underwent lumbar puncture,    DISCUSSION
          and 34 patients required puncture more than once.
          Symptom duration prior to lumbar puncture ranged    The imaging findings obtained using CT and MRI
          between 3 and 33 days after onset. Hence, we identified   showed the pathological changes that occur in JE
          108 CSF samples (3 in the initial phase, 53 in the acute   patients. JE patients typically demonstrate hypodense
          phase and 52 in convalescence). The mean lumbar     lesions in the thalamus and basal ganglia on CT. MRI
          puncture pressure was 173.41 ± 77.87 mmH O, and     is more sensitive than CT for revealing abnormalities,
                                                                                                              [8]
                                                    2

            30                                                 Neuroimmunol Neuroinflammation | Volume 1 | Issue 1 | June 2014