
Page 805 - Read Online
P. 805
Tredway et al. Mini-invasive Surg 2020;4:78 I http://dx.doi.org/10.20517/2574-1225.2020.77 Page 5 of 11
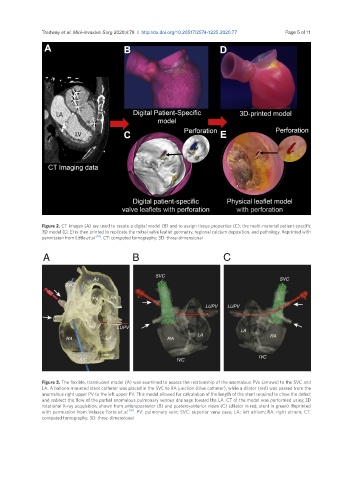
Figure 2. CT images (A) are used to create a digital model (B) and to assign tissue properties (C); the multi-material patient-specific
3D model (D, E) is then printed to replicate the mitral valve leaflet geometry, regional calcium deposition, and pathology. Reprinted with
permission from Little et al. [16] . CT: computed tomography; 3D: three-dimensional
Figure 3. The flexible, translucent model (A) was examined to assess the relationship of the anomalous PVs (arrows) to the SVC and
LA. A balloon-mounted stent catheter was placed in the SVC to RA junction (blue catheter), while a dilator (red) was passed from the
anomalous right upper PV to the left upper PV. This model allowed for calculation of the length of the stent required to close the defect
and redirect the flow of the partial anomalous pulmonary venous drainage toward the LA. CT of the model was performed using 3D
rotational X-ray acquisition, shown from anteroposterior (B) and postero-anterior views (C) (dilator in red; stent in green). Reprinted
with permission from Velasco Forte et al. [18] . PV: pulmonary vein; SVC: superior vena cava; LA: left atrium; RA: right atrium; CT:
computed tomography; 3D: three-dimensional